


We’re a good bit over the “true” halfway point of 81 games, but still a week away from the observed middle point of the season, the All-Star Game, so I thought I’d take a look at how the league was pacing in a few statistics through Sunday:
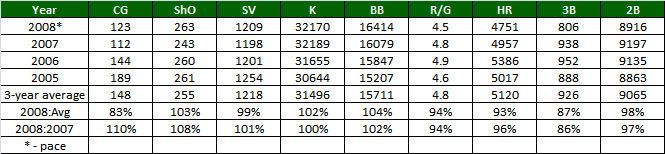
The first half delves into pitching performance while the back-end takes a peek at some pacing in the hitting department, most specifically power. The primary reason I put together the chart was because I had suspected that Complete Games were up this year. Honestly this was probably because last year’s league leader, Roy Halladay, already had six after racking up seven during the entire 2007 campaign. Therefore I thought, perhaps foolishly, that since Halladay was doing it at a more frequent pace, the league must be as well. It is, but hardly at anything close to a record-breaking pace. Furthermore, the 2008 pace is well off the three-year average from 2005-2007 that was undoubtedly much “dirtier” than the game is today.
The league pace is up 8% on Shutouts from a year ago, though I could’ve easily guessed that as a diehard Detroit Tigers fan. Despite having what many believed was one of the best lineups ever constructed, the Tigers have been blanked a vomit-inducing 10 times this season! Their futility alone serves for half of the growth over 2007 and covers all of the difference between the 2008 pace and the three-year average (and then some)!
It was anecdotal evidence that also led me to thinking that pace of Saves was up significantly led by Francisco Rodriguez‘ record-breaking pace as well as George Sherrill‘s bid for 50. I remember seeing Sherrill relieve Felix Hernandez in a Tacoma Rainier’s game against the Round Rock Express a couple years ago. I thought he was pretty good and would eventually be a formidable reliever, but I didn’t think he had 50-save stuff. Of course a look at his peripherals beget that he doesn’t have 50-save stuff (5.1 BB/9). Nevertheless, saves have remained rather static over the past three seasons and this year’s pace is no different.
Naturally I was expecting that with Shutouts up, Runs per Game would be down. Or perhaps I thought they were down because of the article from a few weeks ago I did on power being down. Either way, my beliefs were confirmed as the RpG is down 0.3 from last year (and from the three-year average incidentally). This is likely due in large part to Home Runs still being down 7% over the three-year average and 3% from a season ago. Doubles are down a tick as well quelling the idea that the would-be Home Runs are turned into Doubles. Triples, a seemingly very unpredictable occurrence, are way down from both last and the three-year average. I haven’t the slightest clue as to what that might mean.

Leave a comment