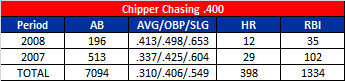
(Editor’s Note: Click on charts for a better view when necessary)
At this time last year, Troy Glaus, Victor Martinez and B.J. Upton each had eight home runs for the year. This year the trio has combined for just five! This fact, among others, has led a bevy of analysts, bloggers and radio hosts to spend ample time hypothesizing about what has brought about the current “power outage” in baseball. Oftentimes the conclusion is that the game has been cleaned up and thus gotten weaker. Is that just the convenient answer that we want to be true or is there some sort of legitimacy to it? Since we can’t really prove whether or not it’s true given the lack of evidence around who was and who wasn’t on PEDs the past several years, this answer will always be largely conjecture. What we can do, however, is take a look at the numbers and see just how much the power has dropped off around the league.
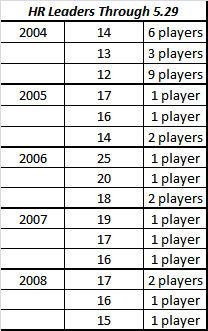
To get an idea of how much, if any, power has dissipated from the game, I looked at several things: Slugging Percentage, Home Runs and Doubles. I also looked at weather just to see if anything interesting struck me, but I don’t think that would come into play until late in the year. I went back to 2004 giving me a complete four-year sampling to compare the first two months of 2008 against. First, I’ll show some of the simpler data I compiled that probably doesn’t have huge correlations year-over-year but can be “fun” to look at when discussing these kinds of things. The following charts focus on the concentration of home runs meaning they fail in giving us the scope we need to judge how far up or down the league’s power is or isn’t right now. What they do offer is an interesting look into how the premier hitters performed during the period studied.
 –
– 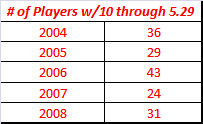
Judging by those two charts, 2006 was a huge power year all around. Two players had 20 or more home runs and a whopping 43 had 10 or more, both are easily the best of all years studied. Sidenote: 2006 was the second hottest year in the United States on record. The above charts might lead you to believe that 2008 has been a more fruitful power year than 2007 and all the talk is just bluster. And this is why we must dig deeper.
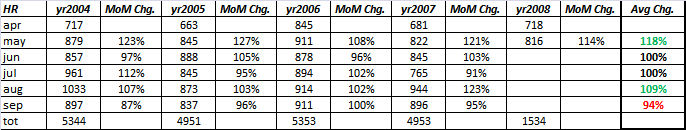
Let’s examine the home run totals a bit more to get more perspective. I took home runs totals by month from 2004 through May of 2008 and then looked at the average of each month. From there, I compared the 2008 April and May totals against the average to see how they stood up. Though the grumblings of a power outage started in earnest during April, the 718 home runs hit reached 99% to the April average (727) and totaled 37 more than April 2007 (681). In fact, outside of the home run happy 2006 season (845 April HRs), the 718 home runs hit this past April was the biggest total of the years studied.
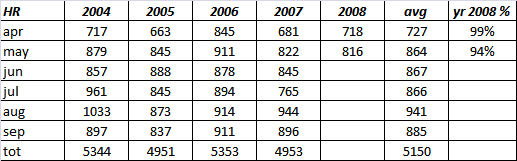
May, however, was a different story. Though just six off of the mark of 2007’s May, the 816 home runs reached just 94% of the average and qualified as the lowest total of the years studied. From 2004-2007, home runs saw a 20% increase from April to May. This year, there was only a 14% increase month-over-month bringing the five year average down to +18%. If the season follows pace and assumes the same percentage gains and losses established from 2004-2007, then there would be about 4900 home runs in 2008, the lowest of the years studied by over 50 home runs.
So the data centered around home run output leaves us with an uneven answer. April home run output was strong by comparison despite that month usually being excused due to inclement weather while the uptick generally enjoyed by the league in May was decidedly absent in 2008 despite the concentration of power being stronger or at least as strong as previous seasons.
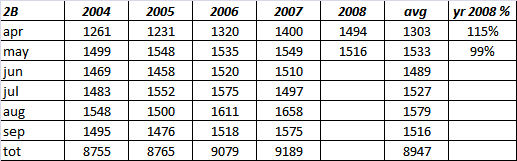
Let’s move onto doubles because contrary to popular belief, power isn’t only about home runs. Legitimate power can and will result in a boatload of double as well. April 2008 gave us the highest double output of all the years studied by far meaning that heading into May it seemed that the assumed power outage had little behind it. The double output in May was only 99% of the average from the sample size once again lending credence those in favor of a power outage.
At this point in my study, I still felt rather uncertain about the results. Some of you probably see where I’m going with this, but I chose present these numbers first because it is primarily what the so-called experts and pundits choose to focus on when decrying the drop of power in the media. These raw totals told me that April was on pace with history and any drops experienced in May appeared negligible. The preceding charts were contrary to everything that the very first chart I put together showed me:

Even though the doubles and home runs totals from April and May suggested that things weren’t all that bad, both months had a depressed slugging percentage when compared against the previous four seasons. Mind you, I’m well aware of the fact that doubles and home runs aren’t the only variables included in slugging percentage, but they are the most common components with the biggest impact. The impact of singles is small as is the frequency of triples. Now we’re nearly 900 words into the piece and we only really needed one chart to show us that power is in fact down in baseball for 2008.
The key was obviously to look at things on a per game basis. Given the random weather patterns in both April and May that cause both rain outs and snow outs leading to various scheduling changes, the raw totals won’t always deliver the full story. Let’s take a look at both home runs and doubles on a per game across the past five seasons in April & May to see how prominent a decline in power has struck the league this year:
 –
– 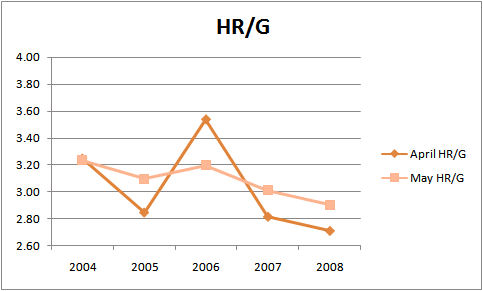
The talking heads got one right, folks. They may not have taken the best path (total numbers), but the two charts found above clearly show that there is a legitimate power decline in the game of baseball right now. Is it because of the crackdown on PEDs? As I mentioned at the very beginning, that is an impossible question to completely answer with the data we have in front of us. The game’s biggest fans that took the constant black eyes bestowed upon the game to heart absolutely want it a crackdown on PEDs to be the answer for the decline. Perhaps the powers in charge have altered the ball back into the favor of pitchers?
After all, 31 starting pitchers have earned run averages below 3.50. And 19 starting pitchers have FIP measures below 3.50. Four of the pitchers with a FIP below 3.50 have an ERA above 3.50 essentially meaning they have been bitten by some bad luck. Unfortunately, I was unable to find an easy way to put together the data to see how many players had similar figures in previous seasons. For all of 2007, only 17 pitchers were on the right side of 3.50 in the ERA category and only nine of them held a <3.50 FIP.
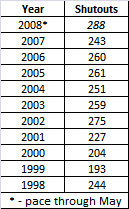
Lastly with regards to pitching, consider that there have already been 96 shutouts this season including nine from the pitiful Detroit Tigers thought in the off-season to be capable of chasing down 1000+ runs scored. Last year, there were 243 shutouts total (40.5 per month). Through May 31st, we’ve already seen 96 shutouts this year. If the 2008 pace holds (48 per month), then we would see 288 shutouts, easily the highest total in the 30-team era:
With four months of play left, the bulk of which will be played in the hottest weather of the year, it is difficult to make any sweeping conclusions. One thing is certain right now, power is down and the margin is statistically valid. For all the heat that Bud Selig takes, it does seem that his concerted effort to crackdown on PEDs in baseball is paying some dividends. Warning track power is the story of the season as are the many wall-scraping home runs that have been a point of consternation through the first two months. So frequent are these close calls that the talk of instant replay on some level in baseball is being heavily discussed nearly as much as the Power Outage of 2008.