Archive for ‘Analysis’

Monday: 08.5.2013

Jim Johnson’s “Regression” Is 5 Bad Innings

When Jim Johnson had his dream season in 2012 – complete with an MLB-best 51 saves – many in the fantasy community screamed “REGRESSION!!” at the top of their lungs. The biggest hurdle for most (I believe) was getting their heads around a low-strikeout reliever being a dominant closer. Johnson’s next 20 percent strikeout rate will be his first and that’s not even special for a reliever let alone a primetime closer. Relievers have averaged a 22 percent rate in each of the last two seasons with the best sitting in the 30s (well the absolute best like Craig Kimbrel and Aroldis Chapman post absurd 45-50% rates).

What didn’t make sense about the cries for regression was the seemingly forgotten or overlooked fact that Johnson threw 91 innings at his 2012 levels the year before with all of his key indicators being nearly equal:

jjohnson1112

Now his ERA indicators were calling for a jump with FIPs of 3.22 and 3.25, but that is hardly egregious. In short, this GB-heavy approach wasn’t a fluke.

Essentially two-thirds through the 2013 season has yielded some interesting results for Johnson as those thinking it couldn’t last might feel justified by his 3.26 ERA and 1.25 WHIP. But are the Johnson naysayers really “right” if the entire “regression” came in about a two-week, five-inning stretch from mid-to-late May? While Johnson’s ERA is more than three-quarters of a run higher than in 2012, you can make a case that he’s actually been better save a 10 percent portion of his season. To wit:

 jjohnsongoodbad

I realize this is some gaming with selective endpoints, but when four of the nine outings during which he allowed earned runs are clustered in about a two-week sample, I don’t think it’s egregious to show the before and after on each side. At its core, this is less about Johnson and more about just how skewed reliever numbers can be given their relatively small innings totals.

If you just lifted those five innings from Johnson’s totals, his numbers are through-the-roof brilliant. We can’t do that, but look at those numbers since he emerged out of his funk; they are quite excellent, too. In that particular sample, his groundball rate is at 66 percent – even better than the astronomical 62 percent rates from the last two years. By the way, he is once again leading baseball in saves with 38 and he’s actually outpacing his 2012 total. His pace of 55 would tie him for the third-most in baseball ever and the most since Eric Gagne hit the mark in 2003.

Always dig into a reliever’s numbers as the front page of their Baseball-Reference profile will often mislead you.

Advertisement
Saturday: 05.4.2013

Jeremy Guthrie’s New “Success”

Jeremy Guthrie has a 3.06 ERA through five starts which looks like a continuation of his post-trade work with the Royals from last season when he had a 3.16 ERA in 91 innings over 14 starts. All told, he had a 3.14 ERA in 123 2/3 innings with 1.10 WHIP. He is blasting the zone resulting in a minuscule 5.8 percent walk rate – a marked improvement over his 6.9 percent career rate. His strikeout rate is at 16 percent as a Royal, up from a 14.3 career mark. Everything seems to suggest he has found a new level of production in his early-30s with his new club.

That strikes me as odd, though.

You don’t usually see a guy with 1111 innings of a certain level of production become something significantly better in their 30s. At least not without a major change in their pitch mix either by adding a pitch or using what he has differently. There hasn’t been any of that with Guthrie which made his improvement even more suspicious. This split of his innings as a Royal definitely stood out:

Guthrie

IP

ERA

WHIP

K%

BB%

vs. CWS

35.7

0.50

0.81

21%

2%

vs. Rest

87.7

4.21

1.31

14%

7%

Guthrie has owned his Saturday night opponent since becoming a Royal and it is driving his new found success. Against the rest of the league, he’s simply been the solid, if unspectacular Jeremy Guthrie we’ve known for nearly a decade, but he’s a Cy Young frontrunner against the Pale Hose. Let’s see if he continues the dominance tonight in Kauffman Stadium.

For those wondering, two of these five starts have come in Kauffman Stadium and he’s allowed five runs, but only one earned in 13 2/3 innings with nine strikeouts and two walks.

Friday: 04.12.2013

Barry Good? Not Likely.

It doesn’t take a revisionist historian to understand that the 7 year, $126 million dollar deal that the Giants gave Barry Zito was a bad idea. Looking at the results of the nearly completed deal certainly backs up those of us who thought it was an overpay at the time, but the eroding skills and results during his final years in Oakland showed a guy who was morphing from a good pitcher to an innings eater. Innings eaters shouldn’t get seven year deals, let alone $18 mil a year on top of that.

Zito had the one great season when he stole a Cy Young Award away from Pedro Martinez, but otherwise his key attribute was reliability as he a near-certainty for 34-35 starts a year. His coda with the A’s saw rapidly dwindling ability paired with remarkably fortunate ERA totals that hid from plain sight his drop into mediocrity. The first suspected culprit would be his home ballpark, known for fueling ERAs that easily outpaced the accompanying skill. Alas it was actually his road work that kept him afloat with two sub-4.00 ERAs in his final two years.

zitolast3

The results compared against the advanced ERA indicators further showed the impending doom:

zito3chart

Flash forward six-plus years and it’s not too surprising that Zito’s San Francisco career has yielded 1020 innings of 4.41 ERA, 1.40 WHIP, and 1.58 K/BB. In other words, he has been the innings eater we saw developing back in his late-20s logging 32 or more starts in all but one of his seasons with the other Bay Area ballclub (2011).

Two starts into the final year of this nightmare deal for the Giants has seen Zito mow down his competition for 14 scoreless innings, a 2-0 record, and an even 1.00 WHIP. Maybe it is the difficulty of finding topics early in the season or maybe some actually believe it to be true, but these two outings have spurred talks of some sort of rejuvenation for Zito with some suggesting that a situation may arise where he is on the cusp of 200 innings and the Giants may be inclined to fiddle with him in the rotation to avoid that threshold as it would kick in a 2014 vesting option for $18 million dollars. Slow your roll, folks.

Zito hasn’t yet thrown 200 innings as a Giant and only once has he been better than league average by ERA- registering a 98 in 2009, or two percent better than league average. Meanwhile, his next 2.0 K/BB ratio with the Giants will be his first. Furthermore, we’ve been down this road before.

First off, something about season openers sits well with Zito. In his last four season debuts, he has a 0.96 ERA and 0.68 WHIP in 28 innings with all three runs given up in 2011. He stayed hot in 2010 posting a 1.53 ERA and 0.88 WHIP in 35.3 innings across five stats. His opponents in those five starts included four of the worst offenses in baseball that year: Houston (29th in wRC+), Pittsburgh (28th), LA Dodgers (22nd), St. Louis (12th), and Colorado (27th on the road). The rest of the year he put up a 4.72 ERA and 1.45 WHIP in 164 innings.

He did it all again last year. After kicking off the season with a shutout of the Rockies (in Colorado no less!), he reeled off another trio of gems yielding a 1.67 ERA and 0.93 WHIP in 27 April innings. He deserves plenty of credit for thwarting the Rockies in Coors as they were the 8th-best home offense, but the next three outings came against Pittsburgh (26th), NY Mets (22nd), and Cincinnati (23rd, but in fairness, 17th at home). The rest of the way? He was quite pumpkin-like with a 4.58 ERA and 1.47 WHIP in 157.3 innings.

There is nothing in the 35 year old’s game that suggests these first two starts are indicative of a forthcoming strong season. His velocity continues to drop toward Moyerian levels checking in at 82.9 MPH this year, continuing a four-year plunge from 2009’s 86.5 MPH. It will be a major upset if he is an above average starter for 200+ innings and these first two starts don’t change the odds much, if at all. Fantasy managers, step away from your waiver wires, there’s nothing to see here.

Wednesday: 02.13.2013

Countdown to Spring Training: 9 Days – Stubbs Stance

Only 9 days until live game action…

What happened to a player essay for the Countdown?

DREW STUBBS

News out of Goodyear, AZ today from Jerry Crasnick discusses how Drew Stubbs is looking to discard his leg kick in hopes that it might boost his batting average and more importantly cut his vomit-inducing strikeout rate.

Stubbs is hoping to emulate the success of former Arizona Fall League teammate Austin Jackson, who took a major step forward as a hitter after jettisoning his leg kick for a toe tap. Jackson raised his batting average from .249 to .300 and cut his strikeout total markedly in 137 games with Detroit. (full story)

Stubbs has been headed the wrong way, while Jackson’s change last year led to a huge breakout season stunted only by an injury.

stubjax

From a homer & stolen base standpoint, Stubbs has Jackson beat easily, but his massive strikeout rate has just tanked his batting average and if he wasn’t an outstanding centerfielder defensively he might have lost a lot of playing time in 2012. There are a lot of stories like this every Spring Training and other noise about weight changes and desires to steal bases, etc…

This, like a new pitch, is a discernible change in approach so they should be placed atop the list in terms of newsworthiness. The key will be whether or not it works and then of course whether or not he sticks with it. With Jackson it was obvious very quickly, to me at least. I personally saw a difference in him in week one which I mentioned to anyone who would listen. Watching every Tigers game definitely helped me there. I don’t watch nearly as many Indians games, but I’ll be keeping an eye on Stubbs.

He is costing nothing this mock season so he might be worth a late flier as your reserve outfielder. If this is something that make him even a steady .260 hitter, then he can be a huge impact player.

Monday: 02.11.2013

Countdown to Spring Training: 11 Days – Denard Span

Only 11 days until live game action…

DENARD SPAN

It isn’t too difficult to be excited about the Denard Span move to Washington. He was traded there this offseason for prospect Alex Meyer. Here is big reason why the Nationals were high enough on Span to trade their 2012 #6 prospect who now becomes Minnesota’s 2013 #4:

spandefense

His sparkling defense is ever-present and adds a lot to his value. He gives the Nats the true centerfielder they’ve been after for years. Bryce Harper and Roger Bernadina turned a strong combined effort last year, but the five years before were mediocre or worse:

span1

Compare that with Span producing fWAR totals of 3.1, 4.1, 2.6, 2.2, and 3.9 from 2008 through last year with the 3.1, 2.2, and 3.9 coming in 94, 70, and 128 games, respectively. The primary challenge will be staying healthy enough to give the Nats a full season so he can return to his 4-win levels. While he gets plenty of value from his defense in center, he also has a solid bat, especially for a leadoff man. His walk rate started at 11 percent over his first two seasons before dipping a bit, but it has held steady in the eights every year since with last year’s 8.3 still holding above the 8.0 league average.

Span isn’t special in either of the flashy offensive categories in fantasy: homers or steals, but he has a chance to deliver big value in the two overlooked categories: batting average and runs scored, especially the later. He is a career .284 hitter and he hit .283 a year ago, but his line drive rate is on the rise moving from 18 percent in 2010 to 21.3 percent a year ago and he is speedster with a heavy groundball lean posting a career high of 54.4 percent last year (compared to 53.8 for his career) so he has the makings of a greater than .300 average. Last year he was just 10 hits from a .302 average. It’s not a stretch to see him hitting or exceeding .300 as soon as 2013.

He could be ready for his first 100-run season in 2013, too. His career-best was 97 back in 2009 in just 145 games. Last year, the Nationals leadoff spot scored 96 runs which were right about league average ranking 14th in baseball despite the fact that only Jayson Werth carried an OBP over .312 in that role. This bodes well for Span.

(Courtesy of ESPN)

(Courtesy of ESPN)

Even at his worst, Span carried a .328 OBP (2011) and the heart of the Nats order is stacked this year. Even if you factor in some regression for Adam LaRoche on the heels of his second-best season, it is offset by a full seasons of Harper and Ryan Zimmerman. Harper started 2012 in the minors while Zimm started 2012 like he was in the minors carrying a sub-700 OPS into the All-Star break, though he eventually finished with a strong 824. Now batting fifth again, it wouldn’t be surprising to see Werth focus on bringing the power aspect back into his game in full force. It all adds up to one of the deepest groups of 2-5 hitters in the league.

A healthy Span – and he seems to have finally put the frightening concussions issues behind him – is looking at a .300-100-7-55-15 season with the high-powered Nats.

Sunday: 02.10.2013

Countdown to Spring Training: 12 Days – Chris Carter

Only 12 days until live game action…

CHRIS CARTER

I mentioned when I wrote about Carter on Monday that this would probably be the Houston entry for the Countdown. Writing about Jose Altuve would be too obvious (though I do have obvious selections in the Countdown *cough* Wrench *cough*) and frankly there just aren’t any other Houston hitters I’m particularly interested in writing about, sorry Marwin Gonzalez. Instead of a straight regurgitation, I do have some new commentary about Carter.

Don’t be afraid of his batting average. It’s going to be bad, that’s a lock. There have been nine instances of someone posting a 30 percent or higher strikeout rate in a full season of work the last three years and only twice did their average top .244 (Chris Davis at .270 last year, Adam Dunn at .260 in 2010). Five of the 10 were at .221 and below. But you can afford to draft one anchor, maybe even two if you have two virtual certainties for .315 or better like Joey Votto and Joe Mauer. I usually only recommend the one, though. So if you want to target Carter (and you should given his massive power) then you are taking Dunn, Dan Uggla, Ryan Howard, and Mark Reynolds types off the table unless you want a batting average deficit that you will struggle with all year.

Meanwhile, the Astros confirmed that they are considering trying Carter at leftfield which is where MLB Depth Charts had him from the jump so that really enhances his chances at a full season of playing time. He is also slotted into the cleanup spot in the lineup which is good even on a terrible team. He is still going to struggle for RBIs because of his team environment, but at least he has a chance to maximize his RBI opportunities.

Playing for such a bad team should keep Carter’s reasonable even as the hype starts to build after this trade. Though far from a unique skill set, it is still a desirable one. As we see more and more leagues shift to on-base percentage, we see players like Carter get more appreciated for their overall value so definitely bump him up a considerable amount if you do play with OBP.

Now here is Monday’s initial piece and the addendum together.

The Astros have a front office that understands how to rebuild. The best way to do it is to truly burn it to the ground and start over. In their latest such move, they traded Jed Lowrie and Fernando Rodriguez for Chris CarterBrad Peacock, and Max Stassi. A 29-year old shortstop who is on the team until at least 2015 isn’t a bad asset for a rebuilding team like Houston, but a 26-year old slugger (who is probably a DH, but ostensibly can play first base or maybe leftfield which is where MLB Depth Charts has him as of now) and a 24-year old prospect arm who are under team control until 2019 are much better. This move is perfect for Carter.

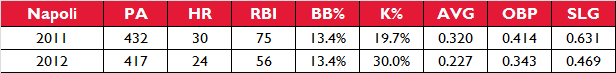
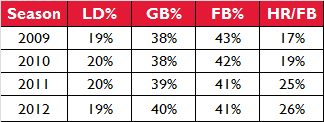
Carter got his first real shot last year and popped 16 homers along with a .239/.350/.514 line in 260 plate appearances. He did strikeout 32 percent of the time, but also carried a strong 15 percent walk rate. He’s a classic three true outcome player and his new home is tailor-made for his game. His power plays anywhere so even in his cavernous home ballpark with Oakland he still had a .458 slugging percentage (the A’s as a team had a .392 slugging percentage at home) and five home runs despite the 89 home run park factor for right-handers. His move to Houston brings a major improvement to home venue as Minute Maid Park yields a 109 park factor to righties on home runs.

Plus, with Houston’s move to the AL West, Carter’s favorite venue from 2012 is still in play as he hit three of his 11 road homers in Texas in just six games. When you are dealing with a 260 plate appearance season, any parsing of that data is going to be subject to small sample size issues as the whole is already just a half season so keep that in mind, but it’s not like this power appeared out of nowhere for Carter. It’s always been his calling card so even with the scant samples, I’m confident in projecting that this move is a huge benefit for him. Consider also that his 182 home runs in 3647 plate appearances as a minor leaguer translate to about 30 per 600 plate appearances (29.9 to be exact). He hit 65 of those home runs in 1277 PAs in Triple-A which actually tops that overall rate checking in at 30.5 per 600 PA.

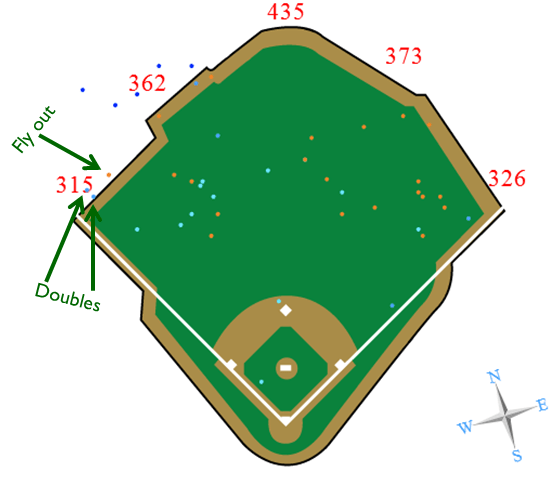
Thanks to Katron.org’s balls in play project, we can get a sense of how Carter might fare in Houston, or at least how he would’ve fared in Houston with last year’s batted ball distribution. The following is a mapping of Carter’s batted balls in Oakland on a Minute Maid Park overlay. You will see three leftfield batted ball outcomes labeled for what they were in Oakland, which would’ve likely gone for home runs in Houston. There is also a handful of warning track shots in left centerfield that might’ve gotten out in Houston depending on various circumstances. Meanwhile the five home runs were all no doubters on the Minute Maid overlay. Be mindful that this is all academic as he won’t have the exact same batted ball distribution in 2013, but it gives some sense of how his power production can improve with his new club.

CarterinMMP

By the way, Jed Lowrie was my Houston pick for the Countdown to Spring Training so don’t be surprised if this re-runs for the Houston CtST entry down the road. If I can find someone else I’m interested in, I’ll definitely go another way, but Carter is someone I really like so this fits pretty well, too. I didn’t really want to hold this analysis until Houston’s day, either. Meanwhile, Lowrie is unlikely to hold a spot in the Countdown as I had my eye on someone else for Oakland and don’t know if I want to switch it up.

Addendum:

Earlier today after he was dealt to Houston, I did a piece on Chris Carter and how his power should spike with his new home ballpark. I used the Katron.org balls in play information to outline three batted balls from Carter that would’ve been home runs in Minute Maid Park. It was meant to accentuate the point regarding his likely power improvements in his much friendly environs, but it was greatly flawed. You see, the Katron dots are where the ball is fielded not where it landed. I knew this in the recesses of my mind, but I never gave full thought to the notion and what it means when analyzing this kind of data.

Here is the legend for the Katron data:

katronkey

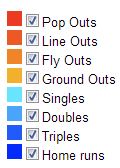
The problem comes in that we don’t know the hit type of singles, doubles, triples, and home runs. So I absent-mindedly assumed (never assume, kids) that the doubles were hit in the air either as line drives or flies. They were not. After getting some education about Katron and the potential flaws with using the data as I did, I went back to the video and found out that my particular examples show just how dangerous using the data as I did can be when the dots represent where the ball is fielded and not where it first hits the ground.

First, let’s look at the doubles:

ccarter1a

ccarter2a

See the problem now? I apologize for that, I simply didn’t put together the inherent flaws of using the data like that. It’s 100% my fault, though, so I’m not crapping on the folks over at Katron.org as it’s even there in bold below the charts:

Every location is where the ball was fielded by a player, not where it landed. You better read this Paul Sporer you stupid dummy. 

That may not be a fully accurate quote from their site.

Perhaps if I had been reading my now-BP-colleague Sam Miller a year ago when he was writing at the OC Register, this all could’ve been prevented.

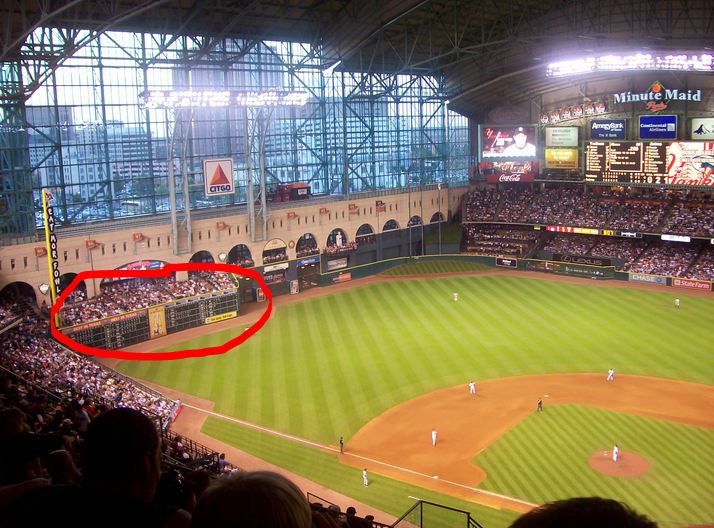
Hey, at least the flyball I highlighted doesn’t have the same issues. There is no guarantee it would’ve been out in Minute Maid, but we see the 367 sign behind Josh Hamilton when he catches it and we know that Minute Maid is 315 for a large portion of leftfield known as the Crawford Boxes.

ccarter3

(click for huge version)

(click for huge version)


Saturday: 02.9.2013

Countdown to Spring Training: 13 Days – Victor Martinez

Only 13 days until live game action…

VICTOR MARTINEZ

The biggest issue with Victor Martinez in 2013 is one being settled before camps even start. His eligibility after a season lost to injury has been a topic of debate especially after CBS decided to make DH-only. I personally don’t agree with the decision at all, but they addressed it head on and there is at least reasoning behind it regardless of whether or not I agree. Both Yahoo! and ESPN will keep Martinez at catcher. He played 26 games at catcher in 2011. I get what Nando DiFino is saying with the “regular catcher” issue in that he hasn’t been a full-time backstop since 2010, but I don’t agree that he “used” his last year of catcher eligibility in 2012 and since he didn’t play he’s no longer eligible.

For those of your in CBS leagues, you should reach out to your commissioners to see how it’s going to be played so you don’t get surprised come draft day when you think you’re stealing a catcher late only to realize he lasted a couple of extra rounds because he is a power-light DH-only player. Speaking of DH, some AL-Only leagues require that you put an actual DH (20+ games there) in that spot as opposed to it being a utility spot for anyone. The usage of the spot in baseball has made that a much easier fill with 32 players registering 20+ games there and 27 of them putting up a 101 OPS+ or better. Add in Martinez and you should have trouble filling spot even after you remove guys like Carlos Santana, Evan Longoria, and Joe Mauer who have way too value at their original position to consider slotting them at DH.

As for Martinez himself, he is poised for another big season. His 12 homers in 2011 were the fewest he’s hit in a full season, but he made up for it with a .330 average and 103 RBIs. His flyball rate dropped from 42 percent in 2010 to just 33 percent, but most of the shift went to line drives explaining his career-best .330 mark. His 24 percent line drive was a career-best for a full season and seven percent higher than his 2010. He could bring his average back down to his .303 career level and still push 100 RBIs, but he would likely need the power to return a bit closer to the 20s we were used to from him prior to 2011.

In 2011, he had the bad Austin Jackson leading off with just a .317 on-base percentage. It was also Magglio Ordonez’s final season and he was hardly himself with just a .303 OBP. Miguel Cabrera was still excellent and Brennan Boesch had his best season. In 2013, V-Mart likely gets a much better Jackson setting the table while Torii Hunter will probably be close to what Boesch was that year (.341 OBP). Of course the treat is the Cabrera-Prince Fielder combo just ahead of him.

Last year Delmon Young was the primary fifth hitter for the Tigers. He managed a whopping .261 with men on base resulting in 63 RBIs. In 2011, Martinez hit an amazing .404 with men on. I wouldn’t expect a repeat there, but even his career .324 is markedly better than what Young offered a year ago. Young’s 63 RBIs came on 70 hits, a 90 percent ratio. Martinez’s ratio for his career with men on is 99 percent (664 RBIs on 670 hits). The league as a whole with men on a year ago was at 95 percent (17077-for-18073). Young had 268 ABs with men on last year and Martinez had 270 two years ago, so giving Martinez 269 this year with a .324 average is 87 hits. Using the league average (to be conservative) 95 percent RBI/Men on Hits ratio yields 83 RBIs.

He had just two solo home runs in 2011 after full seasons of 14, 10, 10, 15, 15, and 10 spanning 2004-2010 taking out his 67-game 2008. That’s an average of 12. Even that leaves us just short of 100 RBIs. Of course these are just estimates. He could get more at-bats with men on, he could simply hit better than .324, or drive in more guys than the league average 95 percent of RBI/MOH.

How his RBI total breaks down, I think he is going to be extremely valuable again in 2013 even if his power doesn’t return and even if you’re locked into using him as a DH-only. Obviously he will have much more value as a catcher, but he will also cost more. The price tag will likely fall significantly in leagues where he is DH-only unless you run into someone wanting to gamble that he accumulates enough games behind the dish. I would strongly advise against that bet. Everything I’ve heard out of the organization has said that he won’t catch at all.

If he is to keep his homer output from 2011, he will be looking to have just the 11th instance of 15 or fewer homers and 100+ RBIs since 1990.

Saturday: 02.9.2013

Countdown to Spring Training: 14 Days – Jeff Keppinger

Only 14 days until live game action…

Just two weeks to game time! Well, 13 days. This is Friday’s entry.

Sorry for the delays, I’m stretched a little thinner than anticipated, but it’s a good thing because it’s extra writing work and of course the SP Guide which is coming along nicely.

JEFF KEPPINGER

There are more impactful players on the White Sox I could’ve written about, but I’m intrigued by Jeff Keppinger in 2013. He is going to be the everyday third baseman batting second for them. Third base has been an issue for quite some time in Chicago. The position has been a hole for the Sox for quite some time. It was temporarily filled last year with at least adequate production when Kevin Youkilis came over via trade, but he was far from the Youk of old. Gordon Beckham was above average there for 103 games in 2009, but the last time they had a full season of above average production at the hot corner was Joe Crede in 2006. Keppinger is far from a star, but he should bring some much-needed stability to the position.

On the fantasy landscape Keppinger’s appeal comes from the fact that he has an everyday job and he qualifies at three infield positions: first, second, and third base. That of course adds corner and middle infield for fantasy purposes, too. He even had 20 games as a DH with Tampa Bay last year so those leagues that require you to use an actual DH will like Keppinger even more. His offensive profile isn’t particularly special, but the flexibility he brings your lineup helps the modest production play up. It’s like a pitcher with a modest fastball, but pinpoint command. Yeah, that’s it… best comp ever.

Honestly, Kepp should be a platoon player and not the good side, but the Sox are giving him the role in full perhaps heartened by his work against righties last year (.302/.352/.403) which was well above his career level against righties (.269/.321/.358). The White Sox got nothing out of their #2 hole last year so even falling back to his career level versus righties combined with his sparkling .333/.376/.487 mark against lefties is going to yield a massive improvement over the .221/.296/.354 performance that the White Sox saw batting second last year. The 650 OPS was tied for third-worst in all of baseball with Minnesota and Seattle, just barely topping Oakland’s 649.

With Adam Dunn, Paul Konerko, and Alex Rios making up the heart of the order behind Keppinger (career .337 OBP), he should be in line to score plenty of runs. He had a bit of a power surge last year popping nine home runs which could jump up past double digits in his new ballpark. That said he is a groundball/line drive hitter which drives his batting average. His flyball rate is actually on the way down dropping to 27.4 percent last year after a 29.6 percent mark in 2010. His 9.2 percent HR/FB rate – his highest since 2006 when he played just 22 games – was responsible for his power surge last year.

I’m not recommending Keppinger as a shallow mixed league play, there is no need to go that deep, but super deep mixed leagues and of course AL-Only leagues can get some sneaky value with a guy like Keppinger. His batting average will be the meal ticket, but if he maintains everyday play all year we could see 80 runs scored, 10-12 home runs, 60 runs driven in. Think of him as 2012 Marco Scutaro-lite without the speed.

Thursday: 02.7.2013

Countdown to Spring Training: 15 Days – Ryan Doumit

Only 15 days until live game action…

The backend of the doubleheader to catch up from yesterday’s missed piece and as I mentioned in the Napoli piece, I’m hoping to get several done this weekend to avoid any more delays as we head into the second half of the countdown.

RYAN DOUMIT

For years, fantasy managers would always wonder aloud “what if Ryan Doumit just stayed healthy one year and got 500+ plate appearances?” We finally know the answer. In 2012, he had a career-high 528 PA and put together a .275/.320/.461 line with 18 home runs and 75 RBIs, in other words he did exactly what we should’ve expected once extrapolating his previous numbers out over 500 PA.

The extrapolation game is dangerous with small samples, but after a while Doumit’s several similar small samples became a large body of work. Only twice in his seven seasons before 2012 did he top 450 PA with the other five yielding 304 or fewer each time. His triple slash stats bounced around a bit as he hit .318 one year and .208 in another, enjoyed a .357 OBP one year and .299 the next, and even had a .501 slugging percentage only to fall to .406 two years later (the .318/.357/.501 are all from his 2008 season).

Through it all, his 528 PA pace (number equals his 2012 total) in homers and RBIs was just about the same:

doumit

While not really a catcher in the conventional sense, he has maintained eligibility behind the dish throughout his career giving him a special appeal to fantasy managers. Offensive upside at catcher often costs a pretty penny and in 2008-2009 so did Doumit. He had an 813 OPS in 2007 leading to a high price tag in the spring of 2008. He backed it up with the season of his career which sent his price sky high heading into 2009. He tanked. He tanked hard. Ever since then, he’s been kind of an afterthought with most resigning to the fact that he’s just never going to play enough.

His value was always in his catcher eligibility, but at his value peak the tantalizing thing about him was the fact that he was only a part-time catcher – playing first and outfield as well – so if he could stay healthy he could rack up the playing time that other catchers wouldn’t since he didn’t need so many off days. That finally came to fruition in his eighth year in the majors.

He started at catcher 56 times, but also logged starts as a DH (48), LF (16), and RF (6). He got some time at first base in one game, too. Can he repeat? At 32 years old, can he log a 500+ PA season, a feat that eluded him for seven years, for the second straight season? The smart money is on “no”. I like smart money. I’m even more likely to avoid the bet this year because the price is once again on the high side. His current NFBC ADP is 170th overall.

I’d rather wait 60 picks and take Alex Avila.

Thursday: 02.7.2013

Countdown to Spring Training: 16 Days – Mike Napoli

Only 16 days until live game action…

Got some make-up work to do! Wednesday was really busy and all of a sudden it was 11:42 PM and clear that I wasn’t going to finish this piece. Hopefully I will be able to get some Top 10 Right Now stuff done today, too, so I don’t have the same issue I had last week.

MIKE NAPOLI

Back in 2004-2005, Mike Napoli hit a combined 60 home runs with 217 RBIs, 190 runs scored, and 21 stolen bases as a catcher in the Los Angeles Angels system. Unfortunately he wasn’t really much of a catcher behind the dish. This would prove to be a problem given his big league manager, former Dodgers catcher Mike Scioscia. Scioscia takes defense behind the plate very seriously so he wasn’t likely to be nearly as enchanted with his three true outcomes catcher as were the fans and fantasy baseball managers.

He debuted in 2006 doing what he does best: rip bombs (16), walk (51), and strikeout (90). All in 325 plate appearances over 90 games. Though he hit a meager .228, his .360 on-base percentage more than made up for it. The next year was more of the same, but in just 75 games. Then 2008 was the best of the bunch. He started a string of 20-homer seasons while also posting a career-best .586 slugging percentage and adding some batting average to a much more palatable .273 mark, but in just 78 games. The “Free Napoli” campaigns were under way by this point. He was on a 36 homer pace over 500 plate appearances.

Fast forward three years.

He played 114 and 140 games during his final two years with the Angels, but he was traded during the offseason following 2010 first to Toronto in that awesome Vernon Wells deal and then four days later to Texas. Finally. It worth noting that not all of time missed was at the hands of Scioscia. Injuries played a role as he had two DL stints in 2007 and another in 2008. In that 2010 season before leaving LA, he’d finally been given a full season (his only 500+ PA season to date) and he was solid, but not special. His walk rate plummeted to a career-worst eight percent while his 27 percent strikeout rate was the second-worst of his career. The trade was almost inevitable.

Staying in Toronto would’ve been perfectly fine, but moving to Texas whetted the appetite of every fantasy baseball manager in the world. What could he do in that park? A lot, it would turn out, but he was hardly feasting on his home venue Coors Field-style. He was actually better on the road that year with 13 homers and a 1011 OPS in Arlington and 17/1078 on the road. He didn’t stay upright as long as in 2010 missing nearly a month to a strained oblique, but he hit 30 home runs for the first time and posting career-best strikeout and walk rates. The most surprising piece of his 2011 was the .320 average. Everyone would’ve bet on 50 home runs before .320.

The follow up wasn’t quite as sweet. To hear some tell it, you’d think he hit eight home runs in 400+ PAs with a .198 batting average. It wasn’t nearly as bad as it is portrayed at some outlets. Coming from 2011’s peak, it was definitely a tumble, but how bad are we really talking about here?

napoli1

The singular difference in those two lines seems to explain everything. Elevating your strikeout rate by 10.3 percent is never a good idea and it will unquestionably cut down the production from the previous year if everything remains the same. How different were these two seasons compared to what he was averaging coming into 2011? I gave the raw averages, but then scaled them to 425 PA to better compare them with 2011-2012.

napoli2

This is more or less the same as 2012 save a sharp difference in strikeout rate. At this point, it is becoming quite clear that 2011 was the outlier. Most fantasy managers knew this deep down, but in their hearts they wanted to believe he could maintain the level now that he was playing in such a hitter-friendly environment and delivering such incredible value as a catcher. Of course the similarities in his numbers aren’t surprising when you look at his remarkably consistent batted ball profile.

napoli3

Only the HR/FB rate and that coincides with moving to Texas. So again, the only significant difference between his 2011 and 2012 seasons is how often he struck out. In 2011, he was striking out far less and it was translating into bundles of hits. In 2012, regression hit hard and actually zoomed by his career rates into a new low.

Diving deeper into his numbers, we see that off-speed pitches ate him alive in 2012, a 180-degree difference from 2011. Was this injury-related? In 2012 Napoli was day-to-day with a head injury, an illness, and twice with quadriceps injuries until the strained left quad finally DL’d him for a month in August.

napoli4

If you didn’t know any better, I could convince you that those are the numbers of two different players. The 2012 performance against off-speed stuff isn’t congruent with the 2009-2010 Napoli, either. Those 2012 numbers add up to a 582 OPS with a 43.5 percent strikeout rate, compared to 757 OPS and 30.8 percent in 2009-2010. Yet again the 2011 performance of 908 OPS and 26.7 percent is a major outlier by comparison.

Where does all of this leave us? If he didn’t have a degenerative hip issue that cost him two years and $34 million dollars from his initial deal with the Red Sox that eventually became a one year, $5 million dollar pact, it wouldn’t be too hard to project that a healthy Napoli improves significantly on his 2012 as his strikeout rate regresses toward previously established levels. The problem is determining the likelihood of a healthy Napoli. Unfortunately, it’s a pretty big unknown making it difficult to value him for 2013.

How much risk can you stomach? His current NFBC average draft position is 104, or the seventh round (NFBC uses 15-team leagues). I personally cannot stomach that much risk. Even if this were normal Napoli and not Nahipoli (please shoot me for that one), you are still talking about a guy who has one 500+ PA season and a peak of 432 otherwise. There is seemingly always something amiss with his body so adding a balky hip that we already know is a mess muddies the waters enough for me to pass altogether. It helps that he likely won’t be catching at all to exacerbate his injuries issues, but even still he won’t be on any of my 2013 teams at this current cost. I’d rather Alex Avila 126 picks later.