So close!
Easily the greatest sport ever…


Only 12 days until live game action…
CHRIS CARTER
I mentioned when I wrote about Carter on Monday that this would probably be the Houston entry for the Countdown. Writing about Jose Altuve would be too obvious (though I do have obvious selections in the Countdown *cough* Wrench *cough*) and frankly there just aren’t any other Houston hitters I’m particularly interested in writing about, sorry Marwin Gonzalez. Instead of a straight regurgitation, I do have some new commentary about Carter.
Don’t be afraid of his batting average. It’s going to be bad, that’s a lock. There have been nine instances of someone posting a 30 percent or higher strikeout rate in a full season of work the last three years and only twice did their average top .244 (Chris Davis at .270 last year, Adam Dunn at .260 in 2010). Five of the 10 were at .221 and below. But you can afford to draft one anchor, maybe even two if you have two virtual certainties for .315 or better like Joey Votto and Joe Mauer. I usually only recommend the one, though. So if you want to target Carter (and you should given his massive power) then you are taking Dunn, Dan Uggla, Ryan Howard, and Mark Reynolds types off the table unless you want a batting average deficit that you will struggle with all year.
Meanwhile, the Astros confirmed that they are considering trying Carter at leftfield which is where MLB Depth Charts had him from the jump so that really enhances his chances at a full season of playing time. He is also slotted into the cleanup spot in the lineup which is good even on a terrible team. He is still going to struggle for RBIs because of his team environment, but at least he has a chance to maximize his RBI opportunities.
Playing for such a bad team should keep Carter’s reasonable even as the hype starts to build after this trade. Though far from a unique skill set, it is still a desirable one. As we see more and more leagues shift to on-base percentage, we see players like Carter get more appreciated for their overall value so definitely bump him up a considerable amount if you do play with OBP.
Now here is Monday’s initial piece and the addendum together.
—
The Astros have a front office that understands how to rebuild. The best way to do it is to truly burn it to the ground and start over. In their latest such move, they traded Jed Lowrie and Fernando Rodriguez for Chris Carter, Brad Peacock, and Max Stassi. A 29-year old shortstop who is on the team until at least 2015 isn’t a bad asset for a rebuilding team like Houston, but a 26-year old slugger (who is probably a DH, but ostensibly can play first base or maybe leftfield which is where MLB Depth Charts has him as of now) and a 24-year old prospect arm who are under team control until 2019 are much better. This move is perfect for Carter.
Carter got his first real shot last year and popped 16 homers along with a .239/.350/.514 line in 260 plate appearances. He did strikeout 32 percent of the time, but also carried a strong 15 percent walk rate. He’s a classic three true outcome player and his new home is tailor-made for his game. His power plays anywhere so even in his cavernous home ballpark with Oakland he still had a .458 slugging percentage (the A’s as a team had a .392 slugging percentage at home) and five home runs despite the 89 home run park factor for right-handers. His move to Houston brings a major improvement to home venue as Minute Maid Park yields a 109 park factor to righties on home runs.
Plus, with Houston’s move to the AL West, Carter’s favorite venue from 2012 is still in play as he hit three of his 11 road homers in Texas in just six games. When you are dealing with a 260 plate appearance season, any parsing of that data is going to be subject to small sample size issues as the whole is already just a half season so keep that in mind, but it’s not like this power appeared out of nowhere for Carter. It’s always been his calling card so even with the scant samples, I’m confident in projecting that this move is a huge benefit for him. Consider also that his 182 home runs in 3647 plate appearances as a minor leaguer translate to about 30 per 600 plate appearances (29.9 to be exact). He hit 65 of those home runs in 1277 PAs in Triple-A which actually tops that overall rate checking in at 30.5 per 600 PA.
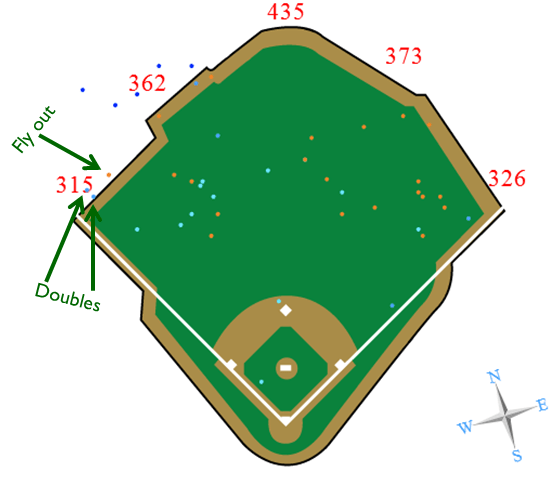
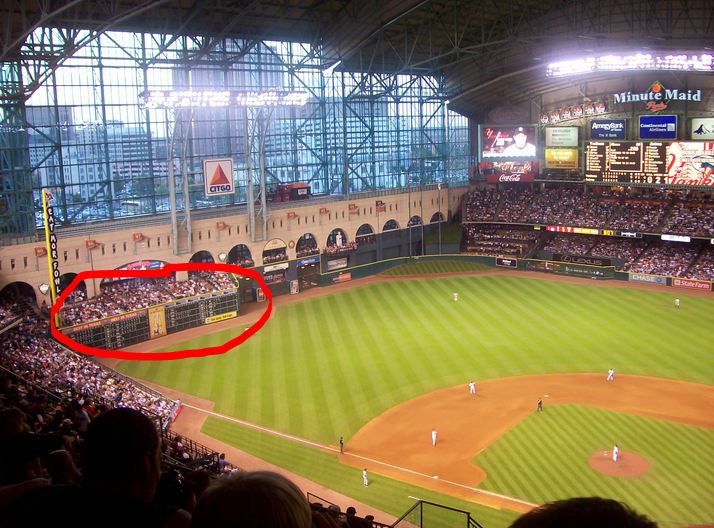
Thanks to Katron.org’s balls in play project, we can get a sense of how Carter might fare in Houston, or at least how he would’ve fared in Houston with last year’s batted ball distribution. The following is a mapping of Carter’s batted balls in Oakland on a Minute Maid Park overlay. You will see three leftfield batted ball outcomes labeled for what they were in Oakland, which would’ve likely gone for home runs in Houston. There is also a handful of warning track shots in left centerfield that might’ve gotten out in Houston depending on various circumstances. Meanwhile the five home runs were all no doubters on the Minute Maid overlay. Be mindful that this is all academic as he won’t have the exact same batted ball distribution in 2013, but it gives some sense of how his power production can improve with his new club.
By the way, Jed Lowrie was my Houston pick for the Countdown to Spring Training so don’t be surprised if this re-runs for the Houston CtST entry down the road. If I can find someone else I’m interested in, I’ll definitely go another way, but Carter is someone I really like so this fits pretty well, too. I didn’t really want to hold this analysis until Houston’s day, either. Meanwhile, Lowrie is unlikely to hold a spot in the Countdown as I had my eye on someone else for Oakland and don’t know if I want to switch it up.
—
Addendum:
Earlier today after he was dealt to Houston, I did a piece on Chris Carter and how his power should spike with his new home ballpark. I used the Katron.org balls in play information to outline three batted balls from Carter that would’ve been home runs in Minute Maid Park. It was meant to accentuate the point regarding his likely power improvements in his much friendly environs, but it was greatly flawed. You see, the Katron dots are where the ball is fielded not where it landed. I knew this in the recesses of my mind, but I never gave full thought to the notion and what it means when analyzing this kind of data.
Here is the legend for the Katron data:
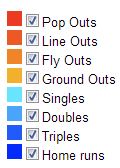
The problem comes in that we don’t know the hit type of singles, doubles, triples, and home runs. So I absent-mindedly assumed (never assume, kids) that the doubles were hit in the air either as line drives or flies. They were not. After getting some education about Katron and the potential flaws with using the data as I did, I went back to the video and found out that my particular examples show just how dangerous using the data as I did can be when the dots represent where the ball is fielded and not where it first hits the ground.
First, let’s look at the doubles:

See the problem now? I apologize for that, I simply didn’t put together the inherent flaws of using the data like that. It’s 100% my fault, though, so I’m not crapping on the folks over at Katron.org as it’s even there in bold below the charts:
Every location is where the ball was fielded by a player, not where it landed. You better read this Paul Sporer you stupid dummy.
That may not be a fully accurate quote from their site.
Perhaps if I had been reading my now-BP-colleague Sam Miller a year ago when he was writing at the OC Register, this all could’ve been prevented.
Hey, at least the flyball I highlighted doesn’t have the same issues. There is no guarantee it would’ve been out in Minute Maid, but we see the 367 sign behind Josh Hamilton when he catches it and we know that Minute Maid is 315 for a large portion of leftfield known as the Crawford Boxes.
(click for huge version)
Only 15 days until live game action…
The backend of the doubleheader to catch up from yesterday’s missed piece and as I mentioned in the Napoli piece, I’m hoping to get several done this weekend to avoid any more delays as we head into the second half of the countdown.
RYAN DOUMIT
For years, fantasy managers would always wonder aloud “what if Ryan Doumit just stayed healthy one year and got 500+ plate appearances?” We finally know the answer. In 2012, he had a career-high 528 PA and put together a .275/.320/.461 line with 18 home runs and 75 RBIs, in other words he did exactly what we should’ve expected once extrapolating his previous numbers out over 500 PA.
The extrapolation game is dangerous with small samples, but after a while Doumit’s several similar small samples became a large body of work. Only twice in his seven seasons before 2012 did he top 450 PA with the other five yielding 304 or fewer each time. His triple slash stats bounced around a bit as he hit .318 one year and .208 in another, enjoyed a .357 OBP one year and .299 the next, and even had a .501 slugging percentage only to fall to .406 two years later (the .318/.357/.501 are all from his 2008 season).
Through it all, his 528 PA pace (number equals his 2012 total) in homers and RBIs was just about the same:

While not really a catcher in the conventional sense, he has maintained eligibility behind the dish throughout his career giving him a special appeal to fantasy managers. Offensive upside at catcher often costs a pretty penny and in 2008-2009 so did Doumit. He had an 813 OPS in 2007 leading to a high price tag in the spring of 2008. He backed it up with the season of his career which sent his price sky high heading into 2009. He tanked. He tanked hard. Ever since then, he’s been kind of an afterthought with most resigning to the fact that he’s just never going to play enough.
His value was always in his catcher eligibility, but at his value peak the tantalizing thing about him was the fact that he was only a part-time catcher – playing first and outfield as well – so if he could stay healthy he could rack up the playing time that other catchers wouldn’t since he didn’t need so many off days. That finally came to fruition in his eighth year in the majors.
He started at catcher 56 times, but also logged starts as a DH (48), LF (16), and RF (6). He got some time at first base in one game, too. Can he repeat? At 32 years old, can he log a 500+ PA season, a feat that eluded him for seven years, for the second straight season? The smart money is on “no”. I like smart money. I’m even more likely to avoid the bet this year because the price is once again on the high side. His current NFBC ADP is 170th overall.
I’d rather wait 60 picks and take Alex Avila.
Only 17 days until live game action…
With 30 days to go, I started profiling a hitter per day highlighting one from each team. I selected my player of note from each team and then randomized them (which was pretty interesting consider who the final two were after the randomization) so that’s the order I’ll be following.
Just under the wire! It’s still Tuesday for me. I went to dinner with my podcast co-host and long-time friend Jason Collette and I was pumping out SP Guide work all afternoon so the Countdown got short shrift until after dinner.
Stupid sidenote: the last four Countdown entrants have first names that start with “A”. Isn’t your life better now?
ALEX GORDON
Drafted with the second overall pick in 2005, Alex Gordon was tabbed as the savior of the franchise almost immediately. He was a mix of George Brett, Ryan Gosling (not yet a mega-star, but he’d done The Notebook so throwing him into the mix was betting on the come back then), and a unicorn. He started his pro career in Double-A and obliterated the league in 2006 vaulting himself to the top of the prospect heap heading into 2007 according to Kevin Goldstein and #2 overall according to Baseball America.
He wasn’t even Gosling circa “Are You Afraid of the Dark?” posting an uninspired .247/.314/.411 line in 601 plate appearances. It got better in 2008, but only because he had set the bar so low. Things actually got worse in 2009-2010 resulting in trips back to the minors in each season where he ended playing 30 and 75 games, respectively, split across a few levels. A hip injury in 2009 cost him three months and that was sandwiched by quadriceps and thumb injuries in 2008 and 2010 that both required time on the disabled list. He was not only failing to live up to the lofty expectations, but through 2010 it was hard not to see him as a bust. He’d had a career 95 OPS+ in 1642 PA.
It all turned around in 2011. He finally stayed healthy again and not only had his best season yet (not a difficult feat given what he’d done to date), but also had a legitimate star-level season. He registered a 7.1 bWAR and 6.9 fWAR in his first full season as a leftfielder, having switched over from third base. He proved to be not only adequate out in left, but exemplary as his 12 kills doubled the next best from a leftfielder (Gerardo Parra, 6) and led all of baseball as he narrowly edged teammate Jeff Francoeur by one.
Finally.
Last year’s follow was a bit off the pace, about a full win at both sites, but still a star level offering. Gordon has hit .298/.372/.478 the past two years in 1411 PA with 37 home runs and 96 doubles, including an MLB-best 51 last year. Are his 37 home runs a disappointment? When he was expected to become Georygos Brettunicornling, I think many were looking at 30 bombs a year. Brett only averaged 17 during his career with a 162-game average of 20, but he never struck out (career 7.8% K rate) so Gordon was supposed to trade those Ks for more homers. It took Brett 9196 PA to strikeout out 634 times; Gordon has fanned 641 times in 3053 PA. Different eras and Gordon isn’t Brett so I’m not holding him to that standard, just showing the incredible gap.
In the midst of his prime at age-29 with back-to-back seasons of 45 and 51 doubles, some are still expecting a home outburst as there is an adage that believes a player with a ton of doubles could start translating some of them into home runs with some added strength and/or a bit of good fortune. The thinking being that with 45+ doubles, several are banging off the wall and just missing their exit from the yard. It’s not a terrible notion, but it’s not a birthright if you are a big doubles hitter, either.
Looking at Gordon’s 2011 with 45 doubles and 23 home runs, there are 79 players with seasons of 45+ and 23 or fewer, but only 12 others including Gordon to have pulled off the feat more than once.

Hey, it’s George Brett! Gordon is fulfilling the expectation after all! What does this group of players have in common? They never really translated the doubles into an abundance of home runs. Brett’s 30 in 1985 are highest of anyone in that group and he didn’t do it after either of his 45 double seasons. The second name on that list is the one that rings truest when I think about Gordon.
In fact, when I was making my list of which players I wanted to cover for the countdown, I was thinking about Gordon and trying to come up with who he reminded me of after his two big seasons in a row and I kept coming back to Nick Markakis and Shin-Soo Choo. There is nothing with that as both as high quality MLB players. Markakis had run off six straight full season of well above average play (117 OPS+) before being limited to just 104 games last year.
The bottom is that the home runs aren’t coming, not at the quantity that was expected of him as a prospect. He’s going to live in the 15-20 range and may have another season or two where he pushed 25, but barring a major change in his approach, 30 just isn’t happening. He is the prototypical line drive hitter with gap-to-gap power. His line drive rate hit a career-high at 25 percent last year and has lived at or north of 20 for his entire career save that 2009 washout. His flyball rate is on a four year decline hitting a nadir of 32.7 percent a year ago, a far cry from his career-best 47.6 back in 2008.
After spending 172 of his last 312 games as a leadoff hitter, he is currently slated to hit third again with Lorenzo Cain leading off. Hopefully this switch doesn’t prompt Gordon to unnecessarily change his approach thinking he has to be “the man” and go for power in that spot. His work in the 3-hole has been 101 points worse from an OPS standpoint than his leadoff work (883 to 782) and 64 points worse in slugging percentage (.501 to .437).
He needs to stick with his approach from 2011-2012. The move to third in the batting order puts 100+ RBIs into play even if he only hits 14 home runs again. That would be a career high by 13 RBI (2011). Meanwhile he could still score 100 as he did in 2011 (101) provided he maintains or improves his 10 percent walk rate. I think he still viewed as an overall disappointment by some which depresses his fantasy price. Current NFBC draft data has him as the 94th guy off the board, inexplicably behind teammate Eric Hosmer. Don’t be afraid to pay for Gordon, especially at this current discounted rate, but even for a little more should your league price him higher. What he lacks in home run power, he makes up in batting average and runs scored, the two most underrated categories in standard 5×5 leagues.
Earlier today after he was dealt to Houston, I did a piece on Chris Carter and how his power should spike with his new home ballpark. I used the Katron.org balls in play information to outline three batted balls from Carter that would’ve been home runs in Minute Maid Park. It was meant to accentuate the point regarding his likely power improvements in his much friendly environs, but it was greatly flawed. You see, the Katron dots are where the ball is fielded not where it landed. I knew this in the recesses of my mind, but I never gave full thought to the notion and what it means when analyzing this kind of data.
Here is the legend for the Katron data:

The problem comes in that we don’t know the hit type of singles, doubles, triples, and home runs. So I absent-mindedly assumed (never assume, kids) that the doubles were hit in the air either as line drives or flies. They were not. After getting some education about Katron and the potential flaws with using the data as I did, I went back to the video and found out that my particular examples show just how dangerous using the data as I did can be when the dots represent where the ball is fielded and not where it first hits the ground.
First, let’s look at the doubles:
See the problem now? I apologize for that, I simply didn’t put together the inherent flaws of using the data like that. It’s 100% my fault, though, so I’m not crapping on the folks over at Katron.org as it’s even there in bold below the charts:
Every location is where the ball was fielded by a player, not where it landed. You better read this Paul Sporer you stupid dummy.
That may not be a fully accurate quote from their site.
Perhaps if I had been reading my now-BP-colleague Sam Miller a year ago when he was writing at the OC Register, this all could’ve been prevented.
Hey, at least the flyball I highlighted doesn’t have the same issues. There is no guarantee it would’ve been out in Minute Maid, but we see the 367 sign behind Josh Hamilton when he catches it and we know that Minute Maid is 315 for a large portion of leftfield known as the Crawford Boxes.

click for huge picture
The Astros have a front office that understands how to rebuild. The best way to do it is to truly burn it to the ground and start over. In their latest such move, they traded Jed Lowrie and Fernando Rodriguez for Chris Carter, Brad Peacock, and Max Stassi. A 29-year old shortstop who is on the team until at least 2015 isn’t a bad asset for a rebuilding team like Houston, but a 26-year old slugger (who is probably a DH, but ostensibly can play first base or maybe leftfield which is where MLB Depth Charts has him as of now) and a 24-year old prospect arm who are under team control until 2019 are much better. This move is perfect for Carter.
Carter got his first real shot last year and popped 16 homers along with a .239/.350/.514 line in 260 plate appearances. He did strikeout 32 percent of the time, but also carried a strong 15 percent walk rate. He’s a classic three true outcome player and his new home is tailor-made for his game. His power plays anywhere so even in his cavernous home ballpark with Oakland he still had a .458 slugging percentage (the A’s as a team had a .392 slugging percentage at home) and five home runs despite the 89 home run park factor for right-handers. His move to Houston brings a major improvement to home venue as Minute Maid Park yields a 109 park factor to righties on home runs.
Plus, with Houston’s move to the AL West, Carter’s favorite venue from 2012 is still in play as he hit three of his 11 road homers in Texas in just six games. When you are dealing with a 260 plate appearance season, any parsing of that data is going to be subject to small sample size issues as the whole is already just a half season so keep that in mind, but it’s not like this power appeared out of nowhere for Carter. It’s always been his calling card so even with the scant samples, I’m confident in projecting that this move is a huge benefit for him. Consider also that his 182 home runs in 3647 plate appearances as a minor leaguer translate to about 30 per 600 plate appearances (29.9 to be exact). He hit 65 of those home runs in 1277 PAs in Triple-A which actually tops that overall rate checking in at 30.5 per 600 PA.
Thanks to Katron.org’s balls in play project, we can get a sense of how Carter might fare in Houston, or at least how he would’ve fared in Houston with last year’s batted ball distribution. The following is a mapping of Carter’s batted balls in Oakland on a Minute Maid Park overlay. You will see three leftfield batted ball outcomes labeled for what they were in Oakland, which would’ve likely gone for home runs in Houston. There is also a handful of warning track shots in left centerfield that might’ve gotten out in Houston depending on various circumstances. Meanwhile the five home runs were all no doubters on the Minute Maid overlay. Be mindful that this is all academic as he won’t have the exact same batted ball distribution in 2013, but it gives some sense of how his power production can improve with his new club.
By the way, Jed Lowrie was my Houston pick for the Countdown to Spring Training so don’t be surprised if this re-runs for the Houston CtST entry down the road. If I can find someone else I’m interested in, I’ll definitely go another way, but Carter is someone I really like so this fits pretty well, too. I didn’t really want to hold this analysis until Houston’s day, either. Meanwhile, Lowrie is unlikely to hold a spot in the Countdown as I had my eye on someone else for Oakland and don’t know if I want to switch it up.
—
Please be sure to check out the addendum to this piece.
Last Friday night, MLB Network unleashed their Top 10 Leftfielders Right Now along with input from host Brian Kenny, co-host Eric Byrnes, and special guest to the series Bill James. There is no real consistency with these lists and that part has been a bit annoying. I’m specifically referring to deciding where to list guys. Why are they listing Martin Prado and Josh Hamilton as leftfielders and Justin Upton as a rightfielder when they will not be playing those positions in 2013?
By their own admission, these lists are also supposed to be projecting the 2013 season so it makes zero sense to do this, especially since they set that precedent with their first episode and listed Shin-Soo Choo in center. I know these lists are for s’s & g’s and despite how it may read, I’m not getting that worked up over it, I’m just trying to have some fun as we move closer toward real baseball.
Here are all four lists from MLB Network-related folks and then I’ll address them separately:
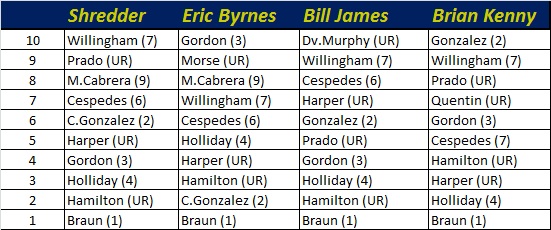
The Shredder
Technically, I only had one difference with The Shredder because had I know they were counting Hamilton and Bryce Harper as leftfielders I’d have done the same. I talked about them in the centerfielder list with Harper actually making the top 10. Since I hadn’t ranked Hamilton in the CF list and realized that the lists were supposed to be a ranking of where they were slated to play, I included him with the rightfielders. With that out of the way, I don’t really have any major problems with The Shredder’s list. I obviously like Carlos Gonzalez quite a bit more, but it seems The Shredder dings him hard for his road stats, as does Brian Kenny which is pretty silly because he still plays in Colorado. If the list is supposed to be about who they are right now and how they’ll do in 2013, how does his poor road work matter when he more than makes up for it at home?
My inclusions they didn’t list: Alfonso Soriano, Brett Gardner, and Justin Upton
Eric Byrnes
Similarly to The Shredder, if you remove the Harper/Hamilton issue then I’m almost in lock-step with Byrnes. In fact, apart from a major difference on Alex Gordon, we about matched on every pick. He seriously underrated Gordon’s defense, but also made a big point out of the fact that Gordon isn’t a 30-home run guy. Neither was Byrnesie in his best year, 2007, during which played left predominantly. Another point he stressed repeatedly was that he felt Cargo was definitely the best defensive leftfielder in the game. It’s Gordon for me, but his claim isn’t outlandish. Oh, and Byrnes seemed to have played WITH EVERYBODY ON EVERY LIST IN THE SHOW.
My inclusions he didn’t list: Soriano, Gardner, and Upton
Bill James
More of the same as we only have one disagreement beyond his ranking guys who aren’t actually leftfielders anymore and Harper. I was really surprised with his ranking of Harper and Hamilton, but I guess he was leaning heavily on the track record differential between the pair. Some of James’ lists during this series have really surprised whether it was a shocking inclusion or questionable positioning of a player. David Murphy had his first 500 PA season last year in what was easily his best season and now he’s a top 10 LF? I don’t see it, Bill.
My inclusions he didn’t list: Soriano, Gardner, Upton, and Melky Cabrera
Brian Kenny
Kenny’s lists have really shocked me, too. I watch Clubhouse Confidential daily so I think I’m pretty well versed in Kenny’s mindset about the game, but then he goes and drops Carlos Quentin seventh on his list after an 86-game season. In fact, Quentin has never topped 131 games and he’s now four years removed from his best season.
My inclusions he didn’t list: Soriano, Gardner, Upton, and Cabrera
Tonight MLB Network will continue the 2013 iteration of their “Top 10 Right Now” series at each position capped off with a “Top 100 Overall***”. They will air both the left and right field shows on Friday evening. I always enjoy this series and generally look forward to it after the New Year since I eat up just about any fresh baseball content I can as we wait for pitchers & catchers to report. Instead of putting up my lists after they air their selections, I’ll post mine ahead of time and then compare notes after the shows air.
***I will not be doing a top 100
I felt I was getting a little verbose on these lists given that they’re really just about having some off-season fun, so I’ve cut the explanations down a bit on these.
The leftfield list was one of the easier ones as the 10 came pretty easily to me. Mike Trout and Bryce Harper will not be included because they were included on the centerfielder list. We saw MLB Network put Shin-Soo Choo on the centerfielder list as well, so they’re going with where guys are expected to play in 2013 thus you won’t see Martin Prado on the list, either, as he will now play third base for the D’Backs. Nor will you see Desmond Jennings as he shifts over to center to replace B.J. Upton. Oddly enough, MLBN was counting new position for guys like Choo and Aroldis Chapman yet they still included Trout with the CFs and he is slated to play left with Peter Bourjos in center.
HONORABLE MENTION
Jason Kubel (ARI) is the only leftfielder who was close for me. His NL debut was impressive, but he just missed out as he lags a bit behind defensively and his bat was good, but not overwhelmingly so.
THE LIST
10. Alfonso Soriano (CHC) – A punching bag for many fans, Soriano hasn’t been the 40-40 guy from his Washington season, but he’s not exactly Vernon Wells, either. In fact, by fWAR he’s earned $98.5mm ($5mm/WAR) on the field while being paid $97mm. Even if you don’t buy the defensive gains, he’s been a plus-hitter for five of six seasons with the Cubs.
9. Melky Cabrera (TOR) – How much do you think PEDs helped Melky? And do you think he’s taken them consistently for two years? Those are the two questions to be asked when analyzing him. I lean toward “some, but not overwhelmingly so” and “no”, so he makes my list. I doubt he’d be the 2012 version of himself even if he kept using, so look at 2011 as a guidepost for his performance.
8. Brett Gardner (NYY) – Speculating a bit here since Gardner missed most of 2012, but when he plays he does everything except hit for power. He plays incredible defense, has game-changing speed, and he’s the Van Gogh of walks—he draws ‘em like crazy!
7. Josh Willingham (MIN) – Staying on the field has been the only real issue with Willy during his career and he’s improving in that avenue improving his games played from 114 in 2010 to 136 and 145 the last two years. Regardless of how often he plays, he’s always raked at the dish and done so enough to cancel out his below average defense.
6. Yoenis Cespedes (OAK) – What an incredible debut! I don’t think anyone saw that coming. He was the commensurate five-tool player hitting .292 with a .505 slugging percentage, playing elite defense in left using his arm to terrify runners into staying put, and stealing 16 out of 20 attempts while also taking extra bases at an above average clip. Imagine if he tops 130 games this year.
5. Justin Upton (ATL) – New to both his team and his position, Upton was finally traded after approximately 212 years of speculation. The potential is overwhelming, but we need to see it more consistently and since we don’t yet, he lands lower than you probably would’ve expected to see him.
4. Matt Holliday (StL) – Only two LF, both regarded among baseball’s best, have topped him with the bat at the position. He pairs the first-rate bat with better defense than you think. Unless you think he plays good-not-great defense boosted by his solid arm and ability to freeze runners.
3. Carlos Gonzalez (COL) – He’s failed to repeat that stunning 2010, but he hasn’t exactly been a slouch in the meantime and his rising walk rate bodes well for his late-20s. He’s yet to play more than 145 games in a season which only make his three straight 20-20 (all w/22+ HR) seasons that much more impressive.
2. Alex Gordon (KC) – The unquestioned best leftfielder in the game defensively speaking whether you trust the metrics or simply use your eyeballs. Mind you, that’s not the only reason he rated this well, he’s also come around big time with the bat including an MLB-best 51 doubles last year. Took him a while, but he’s finally paying dividends on the savior tag that was slapped on him before the ink dried on his contract in 2005.
1. Ryan Braun (MIL) – Duh-doy!
