


When Jim Johnson had his dream season in 2012 – complete with an MLB-best 51 saves – many in the fantasy community screamed “REGRESSION!!” at the top of their lungs. The biggest hurdle for most (I believe) was getting their heads around a low-strikeout reliever being a dominant closer. Johnson’s next 20 percent strikeout rate will be his first and that’s not even special for a reliever let alone a primetime closer. Relievers have averaged a 22 percent rate in each of the last two seasons with the best sitting in the 30s (well the absolute best like Craig Kimbrel and Aroldis Chapman post absurd 45-50% rates).
What didn’t make sense about the cries for regression was the seemingly forgotten or overlooked fact that Johnson threw 91 innings at his 2012 levels the year before with all of his key indicators being nearly equal:
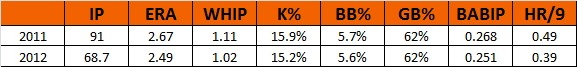
Now his ERA indicators were calling for a jump with FIPs of 3.22 and 3.25, but that is hardly egregious. In short, this GB-heavy approach wasn’t a fluke.
Essentially two-thirds through the 2013 season has yielded some interesting results for Johnson as those thinking it couldn’t last might feel justified by his 3.26 ERA and 1.25 WHIP. But are the Johnson naysayers really “right” if the entire “regression” came in about a two-week, five-inning stretch from mid-to-late May? While Johnson’s ERA is more than three-quarters of a run higher than in 2012, you can make a case that he’s actually been better save a 10 percent portion of his season. To wit:
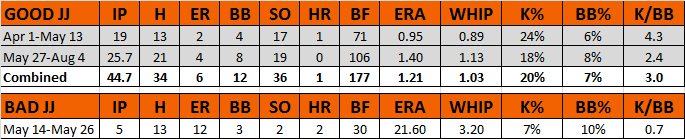
I realize this is some gaming with selective endpoints, but when four of the nine outings during which he allowed earned runs are clustered in about a two-week sample, I don’t think it’s egregious to show the before and after on each side. At its core, this is less about Johnson and more about just how skewed reliever numbers can be given their relatively small innings totals.
If you just lifted those five innings from Johnson’s totals, his numbers are through-the-roof brilliant. We can’t do that, but look at those numbers since he emerged out of his funk; they are quite excellent, too. In that particular sample, his groundball rate is at 66 percent – even better than the astronomical 62 percent rates from the last two years. By the way, he is once again leading baseball in saves with 38 and he’s actually outpacing his 2012 total. His pace of 55 would tie him for the third-most in baseball ever and the most since Eric Gagne hit the mark in 2003.
Always dig into a reliever’s numbers as the front page of their Baseball-Reference profile will often mislead you.
