Archive for June, 2008

Wednesday: 06.4.2008

American League All Stars through May

We’re still over a month away from the Midsummer Classic in the Bronx, but with two full months passed, I wanted to start looking at who I’d put on the All-Star team for each league at this point in the season. For this practice, I’m just going to cover the starter and then an honorable mention. I’m not going to adhere to the every-team-gets-a-player rule since I’m not picking the full team and my picks are going to be in line with the thinking that almost all of the weight is given to the games played this year, that way I’m in line with how the game usually plays out. One final note is that I’m more concerned with fantasy production that “real” baseball production meaning defense is factored in much less. I’ll look at the American League tonight:

Catcher
Joe Mauer, Minnesota Twins – His lack of power doesn’t preclude him from the All-Star Game and hey, he finally got that first home run this week! He has the best OPS of catchers qualified for the batting title (.826), though it’s powered by his .411 OBP that is just four points shy of his slugging percentage. Anyone with a 0.5 K:BB is going to find their way into my lineup.

Honorable Mention: Dioner Navarro, Tampa Bay Rays – He missed some time due to injury, but anyone that adds 158 points to their OPS from the previous season is going to get a look from me. Of course, if the OPS move is from .500 to .658, I don’t care. But .642 to .800 shows some solid improvement if only in a limited sample.

First Base
Kevin Youkilis, Boston Red Sox – What isn’t he doing so far this year? He’s hitting for power as his nine home runs are just seven away from his 2007 total. He hasn’t stopped hitting for average or taking bases on balls with a .305 average and .373 on-base percentage. And he’s displayed some solid speed with two triples and three stolen bases! At least at first base, there is quite a bit more competition than the catcher position we just covered. Even still, Youk has set himself from that competition with great showing across the board.

Honorable Mention: Jason Giambi, New York Yankees
– Spare me the “he’s hitting .253” pleas because a mere three more hits would have him right near .280 and there’d be nothing gripe about on that front. His comeback season has only seen 154 at-bats thus far, but he has 11 home runs already. His fantastic batting eye hasn’t failed him either as he carries a 0.9 K:BB. Yes, that is similar to Mauer in that they both have more walks than strikeouts! What’s more impressive about it from Giambi’s standpoint is he is a power hitter, a profile prone to striking out.

Second Base
Ian Kinsler, Texas Rangers – Anyone familiar with my fantasy axioms knows how much I LOVE power/speed combos. Kinsler fits that bill. I think there might some published work floating around the net that saw me predicting a 30-30 season for him last year. He went 20-20, but only got to play 130 games thanks to injury. I’ll lean on that excuse as the reason he felt short! He has picked up right where he left off with seven home runs and 16 runs batted in. He has more than half the extra base hits he had a season ago with less than half the games played.

Honorable Mention: Jose Lopez, Seattle Mariners
– This pick assumes standard league settings that use batting average and not on-base percentage, in which case I’d take Brian Roberts or Placido Polanco. At any rate, Lopez is hitting nearly .300 while scoring as many runs as can be expected on that ball club and including a pinch of power with four home runs.

Third Base
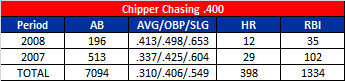
Alex Rodriguez, New York Yankees – But Paul, he doesn’t even have enough at-bats to qualify for the batting title! But reader, he is still leaps and bounds better than anyone else at the position in the American League. His eight home runs place him third behind Adrian Beltre and Joe Crede. Beltre has five more home runs in about 80 more at-bats while Crede has a whopping one more in about 40 more. He has a much better average and OBP than either and he’s right there or ahead of both in runs scored and driven in. His six steals are best amongst them as well, just for good measure. He’s the best player in the game.

Honorable Mention: Mike Lowell, Boston Red Sox – As much as it pains me to put a Yankee and Red Sock as the two picks, I have to be objective about it. Lowell also missed time yet he has still put up the numbers worthy of inclusion to this discussion. He has come off the career-year numbers set last year, but even heading back down near career norms still make him a great option.

Shortstop
Michael Young, Texas Rangers – You want to take about position scarcity? Take a look at shortstop in the American League! Even lowering qualifications down to just 100 at-bats still couldn’t yield a shortstop with an OPS over .800. The Senior Circuit churns out eight such players with the same filter. Nevertheless, Young is about as steady as they come in this game. Looking for a bankable .300 average and 9-14 home runs at short? Pick Young. He’s the type of set it and forget it producer that makes roto players sleep a little easier at night.

Honorable Mention:
None – a homely bunch to say the least.

Outfield

Josh Hamilton, Texas Rangers
– Do I really need to go into details? The kid is positioning himself for a Triple Crown this season (though he is VERY unlikely to get it). That alone is enough to put him in this game and be pleased with his growth. Throw in the story of where he has come from after being a #1 overall pick turned bust turned budding superstar and you’ve got a nice Hollywood movie on your hands. Hamilton is baseball’s MVP right now and he needs only his numbers to back that up, the story is surplus.

Carlos Quentin, Chicago White Sox – Imagine if the Arizona Diamondbacks still had him and he was coming into his own in their lineup instead of Chicago’s! He’s being Magglio’d by Hamilton so far this season. Being Magglio’d, for the uninitiated, is when you’re having an amazing year that would be praised and lauded non-stop during most seasons but gets overshadowed by someone having an off-the-charts season at the same time. A-Rod managed to have a good enough season last year that Magglio Ordonez’ career year was back-burner fodder. Quentin has 15 home runs and 50 RBIs in 198 at-bats so far this season which is one home run better and just 13 RBIs short of his career totals in 395 previous at-bats with the D’Backs.

Grady Sizemore, Cleveland Indians – As with Giambi, I don’t want to hear about his batting average being .253 because he’s just five hits away from a .280 average. I know he didn’t get those five hits so we shouldn’t pretend that he did; the point of saying that is to illustrate how misleading batting average can be when context isn’t given. All he has done is slug 11 home runs and score 32 while driving in another 30 (in that garbage lineup) with 14 stolen bases from the leadoff spot. And an OBP league doesn’t even notice the batting average since he has a tremendous eye that has helped him get a .371 on-base percentage. He remains one of the best players in fantasy baseball. I ranked him 12th overall in my preseason Top 100 Rankings and I stand by that ranking. The kid is a bona fide franchise player.

Honorable Mentions:
Manny Ramirez, Boston Red Sox
– Left for dead after an un-Manny-like 2007, all he has done so far this year is pace himself for another .300-30-100 season. Manny being Manny indeed.

Magglio Ordonez, Detroit Tigers – You’ll get no argument from me that last year was absolutely a career year, but admission of that for some seemed to them to thinking that Ordonez would be a 2008 flop. He has been the only constant in the heavily disappointing Tigers lineup.

Jacoby Ellsbury, Boston Red Sox – Leading the league in stolen bases while putting up solid numbers everywhere else is worthy of attention and it has nothing to do with Red Sox bias (I’m not a fan of the insufferable Red Sox Nation). My friend, who owns him in our AL-Only, has been talking this kid up for a couple of years now and Ellsbury is making my buddy look smarter by the day.

Starting Pitchers
Cliff Lee, Cleveland Indians – Even the non-believers have a hard time punching holes in Lee’s season-to-date performance. Even the poor outing tonight only raised his ERA to 2.45. Beyond that he has a splendid strikeout-to-walk ratio at 5.4 powered by a 7.6 K/9 – his highest since 2004 (8.1). He is riding a career high 1.46 groundball rate to the Promised Land. Considering he has ranged between .71 and .79 his entire career, a regression could be in the future for him. Nevertheless, if the game is today, he gets the ball.

Roy Halladay, Toronto Blue Jays
– Speaking of amazing K:BB ratios.. Halladay is back to his elite levels from 2003 and 2005 with his 6.17 K:BB ratio of 2008. He has used improvements in both strikeouts and walks per nine to achieve the excellent ratio. Despite moving from 5.6 to 7.1 in K/9, he is actually throwing one fewer pitcher per inning, down to 13.8. This has helped him finish five of his 12 starts putting him on pace to crush the seven complete games he had in 2007. The guy is extremely reliable and his ability to pitch, as opposed to throw, portends a career well into his late-30s. He gets the strikeout when he needs it, but he doesn’t rely on it exclusively.

John Danks, Chicago White Sox – The southpaw is coming along much faster than expected after a rough rookie season. In those 139 innings last year, he had some solid indicators, but it seemed like the 23-year old would need another year or two of seasoning before he could be relied upon in the fantasy landscape. Thus far, he’s shown that thought process to be a load of crap. Danks has 180’d from a 0.8 to 1.64 groundball rate while keeping his strikeouts per nine at just over seven. He has shaved nearly an entire walk off of his rate down to 2.6 helping instill confidence that his first 63 innings of 2008 are no fluke. Anyone looking to towards the future already would be wise to invest in him for their keeper leagues.

Middle Relief Pitchers
Jesse Carlson, Toronto Blue Jays – What can you say about a rookie that handles high pressure situations with a 9.1 K/9 rate and strikes out nearly three times as many batter as he walks (2.9) all the while doing a great job at preventing runners from scoring (1.59 ERA)? You can say he is a middle relief All-Star as far as I’m concerned. With middle relievers, you could hand out 15 spots easily, but Carlson holds up well against anyone else.

Santiago Casilla, Oakland Athletics – I realize he is on the disabled list, but his excellence prior to the stint shouldn’t go unnoticed. It took him forever to even give up a run and even still, it’s happened just twice. In his 19.3 innings, he has 22 strikeouts and four walks. It’s a real shame that he got hurt because who knows where his numbers would be otherwise.

Closer
Mariano Rivera, New York Yankees – 0.36 ERA, 0.50 WHIP, 13.0 K/BB, 9 K/9 and 0.7 BB/9. The 38-year old Rivera was left for dead a season ago because he “only” saved 30 games and had an ERA above 3.00 for the first time ever. Nobody bothered to notice that he had his highest strikeout rate since 1996 and walked all of 12 batters in just over 71 innings. His four blown saves were right in line with what he usually does in a season. I am no fan of the Yankees, but I won’t let my dislike for them prevent from bettering my team with their players. Rivera was an absolute bargain in just about every league this year and this record setting effort is emphatically letting everyone know that he’s not done yet.

I’ll look at the NL tomorrow and perhaps some awards races on Friday. Thanks to everyone for your responses on the power piece. I got some great emails and I really appreciated the feedback overall.

Sunday: 06.1.2008

Baseball’s Power Outage

(Editor’s Note: Click on charts for a better view when necessary)

At this time last year, Troy Glaus, Victor Martinez and B.J. Upton each had eight home runs for the year. This year the trio has combined for just five! This fact, among others, has led a bevy of analysts, bloggers and radio hosts to spend ample time hypothesizing about what has brought about the current “power outage” in baseball. Oftentimes the conclusion is that the game has been cleaned up and thus gotten weaker. Is that just the convenient answer that we want to be true or is there some sort of legitimacy to it? Since we can’t really prove whether or not it’s true given the lack of evidence around who was and who wasn’t on PEDs the past several years, this answer will always be largely conjecture. What we can do, however, is take a look at the numbers and see just how much the power has dropped off around the league.

To get an idea of how much, if any, power has dissipated from the game, I looked at several things: Slugging Percentage, Home Runs and Doubles. I also looked at weather just to see if anything interesting struck me, but I don’t think that would come into play until late in the year. I went back to 2004 giving me a complete four-year sampling to compare the first two months of 2008 against. First, I’ll show some of the simpler data I compiled that probably doesn’t have huge correlations year-over-year but can be “fun” to look at when discussing these kinds of things. The following charts focus on the concentration of home runs meaning they fail in giving us the scope we need to judge how far up or down the league’s power is or isn’t right now. What they do offer is an interesting look into how the premier hitters performed during the period studied.
10 or more HR
Judging by those two charts, 2006 was a huge power year all around. Two players had 20 or more home runs and a whopping 43 had 10 or more, both are easily the best of all years studied. Sidenote: 2006 was the second hottest year in the United States on record. The above charts might lead you to believe that 2008 has been a more fruitful power year than 2007 and all the talk is just bluster. And this is why we must dig deeper.

Let’s examine the home run totals a bit more to get more perspective. I took home runs totals by month from 2004 through May of 2008 and then looked at the average of each month. From there, I compared the 2008 April and May totals against the average to see how they stood up. Though the grumblings of a power outage started in earnest during April, the 718 home runs hit reached 99% to the April average (727) and totaled 37 more than April 2007 (681). In fact, outside of the home run happy 2006 season (845 April HRs), the 718 home runs hit this past April was the biggest total of the years studied.

May, however, was a different story. Though just six off of the mark of 2007’s May, the 816 home runs reached just 94% of the average and qualified as the lowest total of the years studied. From 2004-2007, home runs saw a 20% increase from April to May. This year, there was only a 14% increase month-over-month bringing the five year average down to +18%. If the season follows pace and assumes the same percentage gains and losses established from 2004-2007, then there would be about 4900 home runs in 2008, the lowest of the years studied by over 50 home runs.
Month-Over-Month HR Changes
So the data centered around home run output leaves us with an uneven answer. April home run output was strong by comparison despite that month usually being excused due to inclement weather while the uptick generally enjoyed by the league in May was decidedly absent in 2008 despite the concentration of power being stronger or at least as strong as previous seasons.

Let’s move onto doubles because contrary to popular belief, power isn’t only about home runs. Legitimate power can and will result in a boatload of double as well. April 2008 gave us the highest double output of all the years studied by far meaning that heading into May it seemed that the assumed power outage had little behind it. The double output in May was only 99% of the average from the sample size once again lending credence those in favor of a power outage.

At this point in my study, I still felt rather uncertain about the results. Some of you probably see where I’m going with this, but I chose present these numbers first because it is primarily what the so-called experts and pundits choose to focus on when decrying the drop of power in the media. These raw totals told me that April was on pace with history and any drops experienced in May appeared negligible. The preceding charts were contrary to everything that the very first chart I put together showed me:
Slugging Percentage by month
Even though the doubles and home runs totals from April and May suggested that things weren’t all that bad, both months had a depressed slugging percentage when compared against the previous four seasons. Mind you, I’m well aware of the fact that doubles and home runs aren’t the only variables included in slugging percentage, but they are the most common components with the biggest impact. The impact of singles is small as is the frequency of triples. Now we’re nearly 900 words into the piece and we only really needed one chart to show us that power is in fact down in baseball for 2008.

The key was obviously to look at things on a per game basis. Given the random weather patterns in both April and May that cause both rain outs and snow outs leading to various scheduling changes, the raw totals won’t always deliver the full story. Let’s take a look at both home runs and doubles on a per game across the past five seasons in April & May to see how prominent a decline in power has struck the league this year:

The talking heads got one right, folks. They may not have taken the best path (total numbers), but the two charts found above clearly show that there is a legitimate power decline in the game of baseball right now. Is it because of the crackdown on PEDs? As I mentioned at the very beginning, that is an impossible question to completely answer with the data we have in front of us. The game’s biggest fans that took the constant black eyes bestowed upon the game to heart absolutely want it a crackdown on PEDs to be the answer for the decline. Perhaps the powers in charge have altered the ball back into the favor of pitchers?

After all, 31 starting pitchers have earned run averages below 3.50. And 19 starting pitchers have FIP measures below 3.50. Four of the pitchers with a FIP below 3.50 have an ERA above 3.50 essentially meaning they have been bitten by some bad luck. Unfortunately, I was unable to find an easy way to put together the data to see how many players had similar figures in previous seasons. For all of 2007, only 17 pitchers were on the right side of 3.50 in the ERA category and only nine of them held a <3.50 FIP.

Lastly with regards to pitching, consider that there have already been 96 shutouts this season including nine from the pitiful Detroit Tigers thought in the off-season to be capable of chasing down 1000+ runs scored. Last year, there were 243 shutouts total (40.5 per month). Through May 31st, we’ve already seen 96 shutouts this year. If the 2008 pace holds (48 per month), then we would see 288 shutouts, easily the highest total in the 30-team era:

With four months of play left, the bulk of which will be played in the hottest weather of the year, it is difficult to make any sweeping conclusions. One thing is certain right now, power is down and the margin is statistically valid. For all the heat that Bud Selig takes, it does seem that his concerted effort to crackdown on PEDs in baseball is paying some dividends. Warning track power is the story of the season as are the many wall-scraping home runs that have been a point of consternation through the first two months. So frequent are these close calls that the talk of instant replay on some level in baseball is being heavily discussed nearly as much as the Power Outage of 2008.

Sunday: 06.1.2008

Player Focus 6.1.08

I spent the past two evening researching for an article I’ll post on Monday which is why I didn’t have any updates for Friday or Saturday. All of the data needed has been collected so I’ll finish writing the piece of post late tonight so it’s available on Monday morning. For now, some player looks:

Chipper Jones Rebounds from 0-fer with 2 hits
There has never been a question of Chipper Jones’ talent. And until 2004, he was on track to be a surefire first-ballot Hall of Famer, but then the injury bit him, and bit hard. From 1995 to 2003, Jones played less than 153 games just once and it was 140 of Atlanta’s 144 games during the strike shortened 1995. Since then he hasn’t played 137 in any season. The first year that he lost to injuries was also his worst ever despite 30 home runs and 96 RBIs as he hit just .248. The .847 OPS he had that season just goes to show how amazing of a player Jones is even in a down season.

Last year saw Jones net 500 at-bats for the first time since 2003 and he responded with a brilliant season that included 29 home runs and a .337 batting average. He has carried over that excellence in the early part of 2008, hitting over .400 at the June 1st post. With a 2-for-3 (and 3 walks) effort on Saturday, Jones rebounded from an 0-for-5 to ensure he would enter June above the famed .400 mark. Ted Williams’ .406 from 1941 stands as the last time the feat was accomplished and I’m not going out on a limb when I say that it will still be the last time when the 2009 season opens up.
Chipper Jones\' Quest for .400
I’m comfortable trotting out the same reasons against a .400 season that we see anytime anyone is flirting with the mark into late May/early June. The primary of those being that the media pressure as the calendar flipped to September would be too much for ANY man to handle. In this day and age of over-analysis for even the most minor of stories, can you imagine the amount of coverage that would be given to a feat that hasn’t been accomplished in 67 years?! If you thought ESPN was obnoxious now…

It bears mentioning again that hitting a baseball is so difficult that the elite are permitted to fail 7-of-10 times to achieve their status. Despite how hard it is to accumulate hits, we’re now asking for more than one in most games because a simple 1-for-4 or even 1-for-3 effort will lower his batting average! Consider that Williams “only” hit .406 in 456 at-bats and he’s widely regarded as the best hitter the game has seen. Jones’ feat would probably require at least 50 more at-bats and even if he approached the 450 at-bat mark with a .406 average, that’s a pretty small margin of error for that homestretch. Finally, Jones has a great batting eye, but it’s not good enough to propel a run at .400. He has a 14% walk percentage for his career which shouldn’t be scoffed at, it’s tremendous. The 15% rate through May 31st is a big reason why he has been on base at a nearly 50% clip so far this season. Again, it falls short when you start talking about a .400 season… by a lot! Williams posted a remarkable 24% walk percentage during his magical run at .400 and a 21% rate for his illustrious career. Sorry Braves fan, it just isn’t happening.

Ricky Nolasco on Fire of Late
In 2006, the Florida Marlins had to have been impressed by their 23-year old rookie who had put together a solid 11-11 season with a 4.82 ERA in 140 innings. There was plenty of room for improvement, no doubt, but it was definitely a nice foundation to build upon. An elbow injury limited him to 21.3 innings in 2007 making this year his second season for all intents and purposes. He came out of the bullpen for his first two appearances and tossed 5.7 scoreless innings. He joined the rotation on April 11th and promptly allowed five earned runs in five innings, but managed a win nonetheless. His second start was even worse with six earned runs in 4.7 innings and eventually the loss. In the eight starts since then, he has allowed more than three runs just once lowering his ERA nearly two runs in the span from 6.46 to 4.48.

His peripherals over the past three starts are in line with his 2006 totals. In the end, Nolasco likely isn’t a pitcher that should be relied upon to do much more than what he did in 2006. He could shave up to half a run off of the ERA and settle in around 4.30, but that likely stands as the upside at this point. I would tread VERY cautiously in standard mixed league formats (i.e. 10-12 teams), while those over 12 teams with reserve rosters might want to consider stashing him. I doubt he’s available in NL-Only leagues, but he should obviously be picked up if he is on the wire during your transaction period.