


Only 22 days until live game action…
- 30: Desmond Jennings
- 29: Carlos Santana
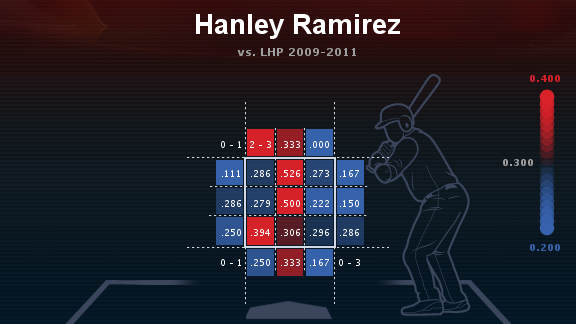
- 28: Hanley Ramirez
- 27: Yonder Alonso
- 26: Pablo Sandoval
- 25: Kyle Seager
- 24: Jose Bautista
- 23: Todd Frazier
With 30 days to go, I started profiling a hitter per day highlighting one from each team. I selected my player of note from each team and then randomized them (which was pretty interesting consider who the final two were after the randomization) so that’s the order I’ll be following.
ADRIAN BELTRE
For today’s countdown piece, I’m going to do things a bit different. With Adrian Beltre, I’m going to offer 22 stats about him to celebrate the 22 days left until game time. He’s been excellent and yet somewhat underrated recently both in “real” baseball and on the fantasy landscape.
- Since getting out Seattle (where he was criminally underrated), he his 19.1 fWAR is second among third basemen to only Miguel Cabrera. Considering Cabrera has played third base just one of those three years, I think it is fair to declare Beltre the best overall third basemen by fWAR since 2010.
- His 19.1 fWAR also lands him fifth on the overall list behind only Cabrera, Joey Votto, Robinson Cano, and Ryan Braun.
- His fielding is no doubt aids his lofty ranking, but his 138 wRC+ is the 13th highest total in the same span (and sits 17th after factoring in ties) so it’s not like he’s been anything but spectacular with the bat, too.
- Over at Baseball-Reference, he rates 4th overall in the 2010-2012 time period with a 19.7 bWAR topped by three of the four from the Fangraphs list. This time Cano sits atop the list followed by Cabrera and then Braun.
- He is pacing the position in all three Triple Crown categories the last three years with 96 home runs, 309 RBIs, and a .314 batting average. He leads by four in home runs over Mark Reynolds, by 28 in RBIs over Aramis Ramirez, and by 19 points in average of David Freese.
- For good measure he’s also leading in runs with 261 over David Wright (238)…
- …and doubles with 115 over Ramirez again (106).
- His last season in Seattle was really the only dismal one despite the entire tenure often being thought of as a bust because he never reached the heights of his .334-48-121 season in 2004, his last year with the Dodgers. Even factoring in the 8 HR/44 RBI swan song in Seattle, he still averaged 21 HRs and 79 RBIs per season with a 162-game average of 24/90.
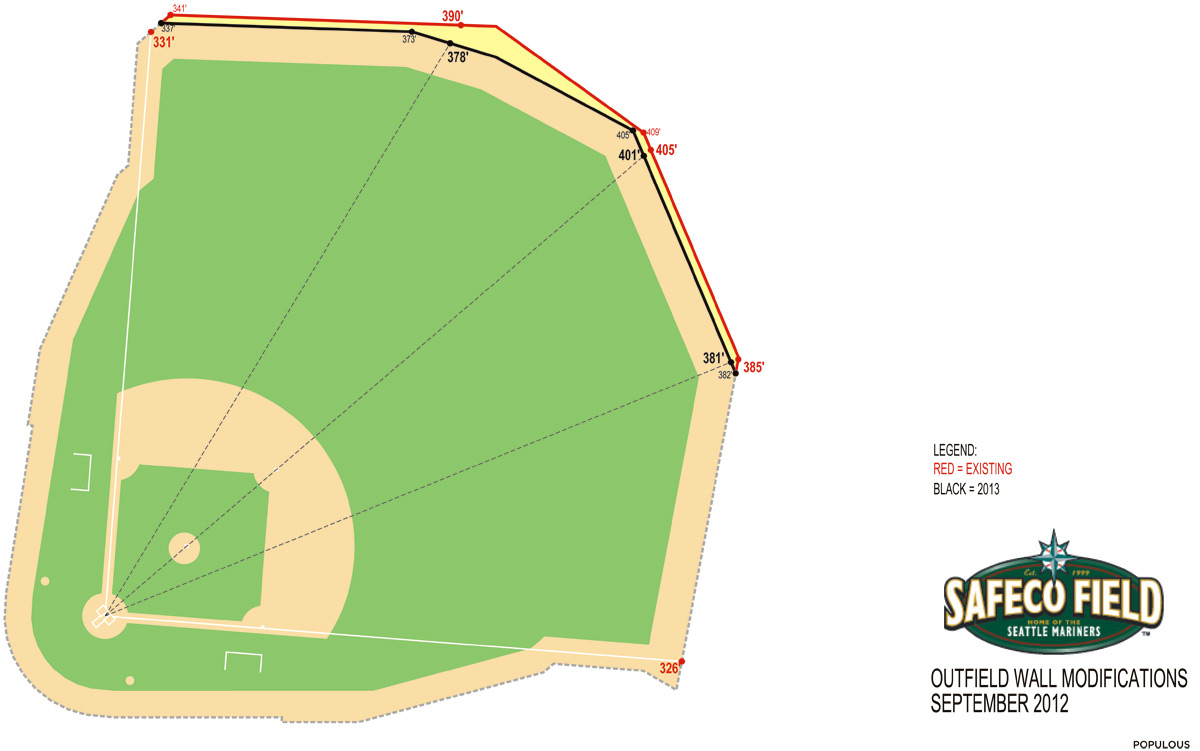
- Imagine if he hadn’t been stuck in Safeco Field for half of his games those five years. He hit a paltry .252/.304/.411 in 1595 plate appearances in his home yard.
- That park remains hell on righties with an 84 park factor for doubles/triples and a 70 park factor for home runs. Only singles are favorable for righties at a modest 102.
- Since transitioning out of Seattle and into a pair of favorable home ballparks the last three years, Beltre is averaging 32 HRs and 103 RBIs with a 162-game average of 36/116.
- Not mention his average has risen from .266 to .314 the last three years.
- He’s handled his early 30s like an all-time great. His 19.7 bWAR is the 7th-best age 31-33 WAR since 1970 and the 12th-best since 1940. He even tops Rickey Henderson and Alex Rodriguez, who tied at 19.6 apiece.
- The greats to top his 19.7 since 1940 include: Willie Mays (31.1), Joe Morgan (25.9), Barry Bonds (25.3), Roberto Clemente (24.8), Jackie Robinson (24.5), Hank Aaron (23.5), Stan Musial (22.1), Mike Schmidt (21.3), Sammy Sosa (21.1), Craig Biggio (20.6), and Pete Rose (20.2).
- Beltre’s 985 OPS versus righties in 2012 was 5th-best in MLB.
- His .609 slugging percentage versus was 3rd-best as were his 30 home runs.
- His 965 OPS in the second half of 2012 was the 8th-best in baseball and that’s with a 697 OPS in July.
- Beltre tied Kyle Seager for the major league lead with nine home runs on 1-0 counts. Don’t get behind to these guys or they will attack.
- Surprisingly, his 1448 OPS in those 1-0 counts was only 7th-best last year. Nick Swisher had an insane 1995 OPS including a .605 batting average.
- But if Beltre got way ahead, he wasn’t as effective. On 2-0 counts he hit just .167 with a 333 OPS. Of course part of that is because of the meager 18 plate appearance sample. So it’s probably better stated that if he got way ahead in a 2-0 count, he wasn’t as aggressive.
- Any plate appearance where he was ahead, he had a .405 batting average with a beastly 1274 OPS and 15 of his 36 home runs.
- His 17 home runs with men on tied him for 4th-most with five other players including Cabrera, Braun, Chase Headley, Josh Willingham, and Alfonso Soriano.
—
These facts aren’t intended to inform you that Beltre is a good player. You already knew that. Instead, they should help you realize that you’re watching a generational talent. He is building a legitimate Hall of Fame case and if that fact has been lost on you to date, well, now you know and you can appreciate the greatness you’re watching at a premium defensive position.
Additionally, these gaudy statistics may help you figure out the answer to the question, “Who should I draft near the end of the first round in my draft this year?” Especially if you are in a bigger mixed league that runs 14+ teams deep, but even you 12-teamers should give him legitimate consideration. Third base isn’t the sinkhole it was a few years ago, but it is a still a premium infield position and filling it with a superstar is a great way to start your team. Hell, Evan Longoria has maintained the lofty draft status without coming close to Beltre’s numbers the last three years. I understand why people are lured in by his potential, but maybe you’d do better with Beltre’s consistency over Longoria’s promise.


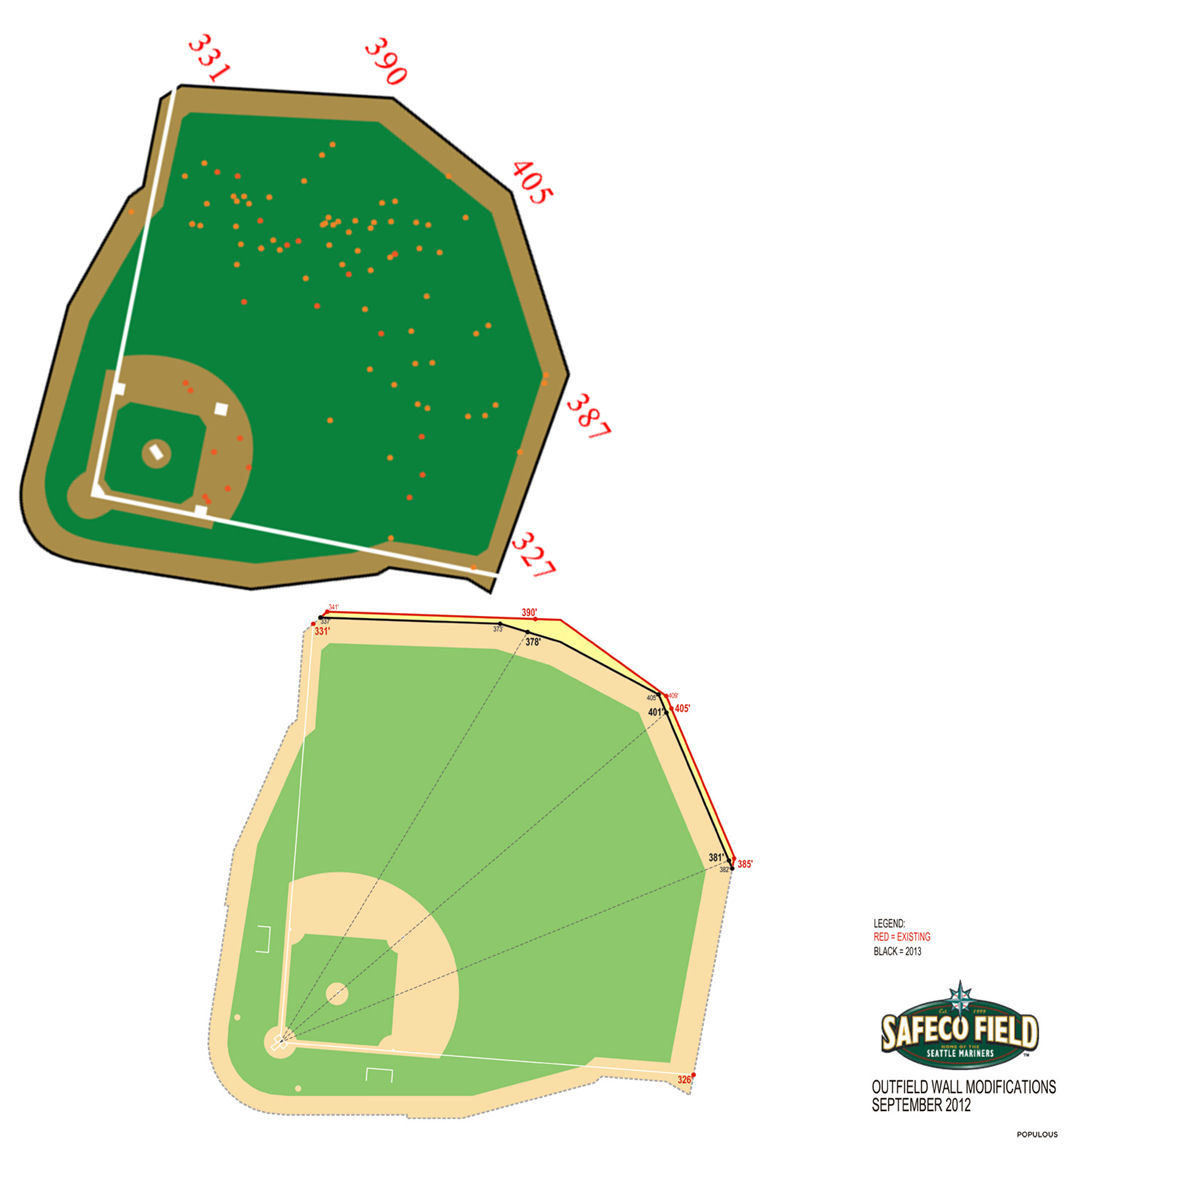

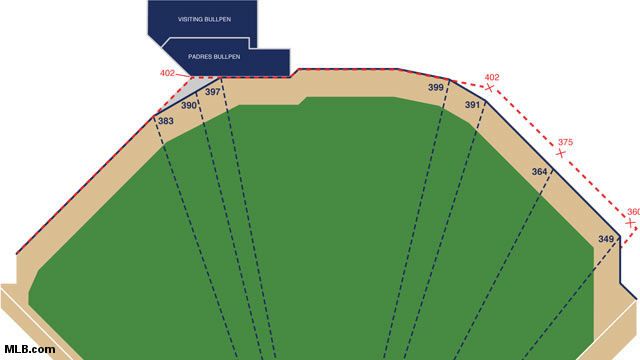
 I circled a pair of outs in red that look like they might be homers in Petco2. Of course, he’d have to have the same exact hit distribution in 2013 and I


