Archive for ‘Off-Season’

Thursday: 01.24.2013

Countdown to Spring Training: 29 Days – Carlos Santana

Only 29 days until live game action…

30: Desmond Jennings

OK, so the first actual Grapefruit or Cactus League game doesn’t take place until February 22nd, but the Red Sox are splitting up their squad and playing a couple of colleges on February 21st so we’re just 30 days away from organized professional baseball. So why not a countdown of this final, grueling winter month that includes some fantasy analysis?

Obviously my primary focus at this site is on pitchers and you’ll get quite a bit of my analysis on them in late February when the SP Guide drops, thus I was thinking of something surrounding hitters. With 30 days to go, I am going to do a hitter per day highlighting one from each team. I selected my player of note from each team and then randomized them (which was pretty interesting consider who the final two were after the randomization) so that’s the order I’ll be following.

CARLOS SANTANA

If you just randomly poll some fantasy baseball managers asking them how Carlos Santana did in 2012, I think you’ll end up with answers suggesting it was a “down” or “poor” season. After all, he did drop nine home runs from his 2011 total, but the perception is likely built around the fact that he ended June with a .220 batting average and 673 OPS. It wasn’t so much that he got off to a poor start, either, he had an 863 OPS in April, but May and June were complete washouts as he put a 592 mark during the two months clearly playing at far less than 100 percent health and the concussion at the end of May certainly didn’t help.

In fact, from the concussion date (May 25th) to the All-Star break, he hit .172 with 527 OPS. With that in mind, how much more impressive are his final numbers of a .252 batting average and 785 OPS? The four days off served him well and he hit .281 with an 887 OPS the rest of the way. Throughout the year he continued to take his walks, but it felt like it was passivity during his May-June slump and he was missing worthwhile pitches opting for the free pass instead. That is based on probably 10-12 games of watching the Indians including some series against my Tigers so if you don’t want to lock that down in stone, I understand. Just letting you know what I saw.

Despite losing essentially two months where he was playing, but struggling majorly, Santana still had a very nice season. He sustained his OPS by raising his on-base percentage to account for the drop in slugging percentage. And he had just three fewer runs batted in despite 49 fewer plate appearances. Lost in the shuffle was the improved strikeout rate dropping from 20.2 to 16.6 percent while lightly boosting his walk rate from 14.7 to 14.9 percent.

Going into 2013, Santana is part a very deep catcher pool and analysts can’t seem to agree exactly where he belongs. There is plenty of established star power at the position with a handful of up-and-comers poised for breakouts, too. For me, he is an easy top three behind no more than Buster Posey and Yadier Molina, but the early rankings have him anywhere from two to seven:

It looks like drafters are following Steve Gardner at USAToday the most early on as his current average draft position has him as the seventh backstop off the board. In an OBP league, he’s easily behind only Posey, but most leagues still use batting average where he has a bit of a deficiency against righties. He is a switch-hitter who fares better against lefties, but he isn’t exactly crushing them, either. He had a .272 average against them last year which isn’t too far from his .278 career mark against southpaws.

An attribute to consider with Santana is his first base & DH playing time. It allows him to get those extra plate appearances that other catchers won’t accumulate and keeps some of the wear-and-tear off of him. This has allowed him to join Joe Mauer as the only two catchers with 600+ plate appearances the last two seasons. Meanwhile his 658 from 2011 is the second-highest total from a catcher since 2006 topped only by former Indian Victor Martinez who had 672 in 2009 with Cleveland and Boston.

Speaking of Martinez, he is another guy who deserves a boost because of playing time. He should still be catcher-eligible in any league worth its salt because of his 26 games there in 2011 when he last played and he won’t have to crouch at all in 2013. He should be the exclusive DH for the Tigers with maybe a couple of 1B starts mixed in to give Prince Fielder the proverbial half day off.

A healthy Santana can bring a .275-90-30-100 season to the table. And yes, I do think he can reach 100 RBIs with Michael Brantley, Jason Kipnis, Asdrubal Cabrera, and Nick Swisher ahead of him in the lineup.

Thursday: 01.24.2013

On Upton

Well, that was rude of you Atlanta & Arizona! I was working on something outlining the teams that would have a legitimate trade package worthy of Justin Upton for the Diamondbacks, but they went ahead and traded him this afternoon. I imagine that happens a lot to baseball writers. They plan something and they’re working on it then circumstances change to render it irrelevant. The trade for those unaware sends Upton and Chris Johnson to Atlanta for Martin Prado, Randall Delgado, Nick Ahmed, Zeke Spruill, and Brandon Drury. And at long lost the D’Backs ditch that scrub Upton. Their eagerness to trade Upton was absolutely absurd, but they got what they wanted and he’s gone. He joins brother BJ Upton in the Braves outfield with Jason Heyward making a ridiculous trio for the NL East contender.

The trade happened about 5 7 hours ago so there is already a ton written about it. I don’t have anything particularly to special to add. I love it for Atlanta, Upton still has superstar potential and it’s never a bad idea to add superstars. The brothers give them right-handed pop to split up Heyward, Freddie Freeman, and Brian McCann (once he returns). Arizona got a nice return, I guess. At least it wasn’t centered around Julio Teheran. Not because I dislike Teheran, but because a blue chip pitching prospect is the last thing they need, even after trading Trevor Bauer. It’s just been a horrible off-season for Kevin Towers and Co. over in the desert. Methinks a meddling owner is behind a lot of this, though.

Want me on the trade? Go here:

Wednesday: 01.23.2013

Countdown to Spring Training: 30 Days – Desmond Jennings

OK, so the first actual Grapefruit or Cactus League game doesn’t take place until February 22nd, but the Red Sox are splitting up their squad and playing a couple of colleges on February 21st so we’re just 30 days away from organized professional baseball. So why not a countdown of this final, grueling winter month that includes some fantasy analysis?

Obviously my primary focus at this site is on pitchers and you’ll get quite a bit of my analysis on them in late February when the SP Guide drops, thus I was thinking of something surrounding hitters. With 30 days to go, I am going to do a hitter per day highlighting one from each team. I selected my player of note from each team and then randomized them (which was pretty interesting consider who the final two were after the randomization) so that’s the order I’ll be following.

DESMOND JENNINGS

Always a tantalizing prospect, the Rays slow-cooked Jennings to the tune of 1004 plate appearances in Triple-A including 397 in 2011 despite the fact that his predecessor, Carl Crawford, had left for Boston via free agency that offseason. When he finally came up that year, he hit the ground running with a 1000 OPS in his first 175 plate appearances which included eight homers, 20 RBIs, 14 SBs, 24 runs scored, and 19 walks. He was doing everything.

Regression, which was probably inevitable, hit and hit hard as he shaved nearly 200 points off of that OPS down to 805 with a .162/.259/.253 line in his final 112 plate appearances. He still scored 20 runs and maintained his 11 percent walk rate, but the hot start caught up to him a bit and since the production came in two so distinct halves of amazing and crap, it generated discussion. It would be an interesting experiment to (travel back in time and) mix up the distribution of his production to small ups and downs that eventually land on the 805 OPS and see if it generates a different discussion. I’m sure it would.

He followed it up with a 2012 that looked more like the 112 PA sample than the 175 PA sample. He was a viable power-speed combo, only one of five players to reach or top 13 home runs and 31 steals*, but the walk rate fell nearly three percent to 8.2 while the strikeout rate remain steady at 21 percent. His home total was well off the 2011 pace which would’ve seen him hit 20 had he amassed the same 563 plate appearances he got in 2012. The doubles and triples held essentially even for those curious. So what happened?

*the other four were Mike Trout, teammate B.J. Upton, Carlos Gomez, and Jason Kipnis. All but Kipnis lapped him with either a lot more home runs or steals (or more of both in the Trout & Gomez cases). 

It is a bit too simplistic to just say that his home run per flyball rate regressed and that ate up his home runs. To a degree, that is exactly what happened, but without digger deeper it isn’t a helpful bit of information. He actually hit a larger percentage flyballs in 2012 moving from 35 to 38 percent and improved his line drive rate by 2.5 percent up to 20.1 percent.  Both of those factors can be good for a power spike, but the flyball contact was far less effective in 2012 as his infield flyball rate nearly doubled from 9.4 to 18.1 percent.

In his short 2011 sample, his flyballs hit off the inner third of the strikezone yielded a 5-for-12 (.417) mark with all five hits leaving the yard. He hit .297 (11-for-37) off the inner third as a whole in 2011. In 2012, he hit just four home runs off the inner third accounting for all four of his flyballs hit in nearly twice as many tries as he went 4-for-23 (.174). He still did plenty of damage off the inner third as a whole going 26-for-76 (.342), but pitchers got better at jamming inside to limit the damage to mostly singles (15 of the 26 hits). He wasn’t turning on those inner third meatballs like this one from 2011:

djennings

It’s one thing to drop your HR/FB rate because you are crushing warning track shots on gusty days or hitting the base of the wall for doubles and triples, but Jennings saw his HR/FB rate evaporate and shift into infield flies, the least successful contact a batter can make thus aiding a 61-point drop in slugging percentage and 47-point drop in isolated power (slugging minus average).

At 26, he is just about to enter his prime and doing so with 874 plate appearances under his belt should give him enough of a base to work from to make adjustments in order to fulfill his immense promise. The potential and youth will keep his price high, but the payoff is massive and even the downside was at least somewhat palatable despite massively underperforming his cost (51st ranked OF; 23rd most expensive) thanks to the steals.

He was the 92nd player drafted last year and his 2012, though under expectations, hasn’t really deterred anyone as he is tracking at 90th overall early on this winter. The composition of my team to that point would determine whether or not I’m willing to pay that eight round price tag.

If I have a foundation of guys with three-four years of track record, maybe Robinson Cano in the first, Adrian Beltre in the second, plus a Billy Butler, Cole Hamels, you get my point, proven veteran rocks; then I’d be more inclined to take Jennings. If you have team centered around Andrew McCutchen (just the one transcendent first round year), Jason Heyward, and Chase Headley, then you should probably go with Austin Jackson or Alex Rios who are being drafted 88th and 91st, respectively.

Tuesday: 01.22.2013

Top 10 SP – Review

On Friday night, MLB Network unleashed their Top 10 Starting Pitchers Right Now along with input from host Brian Kenny, co-host John Smoltz, and special guest to the series Bill James. The results were interesting and perhaps unsurprisingly, I had more gripes with this list than I have any of the previous ones.

Here are all four lists from MLB Network-related folks and then I’ll address them separately:

top10SPListsThe Shredder

Let’s start with the list that comes from their objective machine they call “The Shredder”. Kenny suggests that it is cold and calculated in its evaluation relying heavily on the most recent season, but also not forgetting track record. I have to call heaping amounts of BS on it. It just doesn’t add up. First off, it you’re focusing on “RIGHT NOW”, then how does Roy Halladay still finish fourth? There has to be a lot of subjectivity used to get him there. But that’s far from the most egregious infraction.

If this is supposed to be the most objective tool relying on data only for projection analysis, how does Chris Sale not only make the list, but finish ahead of Stephen Strasburg, Cole Hamels, and reigning Cy Young winner David Price? It had to rely heavily on track record (or pure subjectivity) to get Halladay that high, so then track record would send Hamels and Price rocketing past Sale. Meanwhile, Sale wasn’t better than them last year, either.

Strasburg is probably skewed because he threw just 160 innings, but he was so stellar in that allotted time that it is still a surprise to see him so low. Plus, since I think they had to finagle things to get Halladay that high, surely they could’ve just done the same to get Strasburg into a more reasonable slot. Whatever the case is, I’m done believing that The Shredder is purely objective on any level. And if it is coming to these conclusions based on the data it is being fed, it’s broken and Master Splinter does in fact need to take over.

Maybe I got too caught up in Jered Weaver’s peripherals when leaving him out because I didn’t even give him an honorable mention. I recognize the fact that he is a damn fine pitcher, but I am a strikeout whore and looking over the numbers again I think I focused too much on the plummeting strikeout rate and not enough on his incredible ability to keep runners off the bases, specifically by preventing hits. I still think six is a little high, but I can see how he would fit nicely at 10 bumping the NL version of him (Matt Cain) up to nine and Gio Gonzalez getting moved to an honorable mention.

My inclusions they didn’t list: Cain, Gonzalez, and R.A. Dickey

Bill James

Without treading over well-worn ground too much again, I just can’t see how on a “RIGHT NOW” list James saw fit to put teammates Cliff Lee and Hamels so far below Halladay who is 36 and coming off of an injury-marred season. Plus there’s the fact that he and the Phillies were going to start discussing an extension, but worries about his shoulder scared them off a bit. I still love Halladay as an undervalued fantasy commodity, but as the #4 pitcher right now, I’m a bit more skeptical.

James was the only one to list C.C. Sabathia which I think says more about the depth at the top of the pitching heap than anything else. I certainly don’t fault James for including him nor would I have faulted any of the other participants. He was basically tied with Adam Wainwright on my list at that 13/14 spot, but I gave Waino the mention because I honestly thought CC would appear on most of the lists and didn’t need the extra love.

My inclusions he didn’t list: Cain, Gonzalez, and Dickey

John Smoltz

Smoltzie’s list was close to being my favorite list but including Sale at the expense of Lee was just too much to overlook. Frankly, it doesn’t even matter if Lee wasn’t 11th, just the inclusion of Sale over many more deserving (at least in my estimation) candidates is tough for me. I’m not anti-Sale overall, just when it comes to ranking him this high among the best pitchers right now. Another big season in 2013 could elevate him onto my list next winter, but he hasn’t done enough to pass enough all of these guys just yet.

My inclusions he didn’t list: Gonzalez, Dickey, and Lee

Brian Kenny

I guess by sheer virtue of the fact that we had the most matches (eight), Kenny’s list should be my favorite, but it boggles my mind how he could wind up with Price at nine. Apart from that, our lists are pretty close on the matches we had usually off by just a spot, maybe two, and we had three direct matches (JV, Strasburg, and Hamels). He was adamant about getting Dickey on his list and was the only one to do so which obviously I support, but I just kept coming back to the Price thing. If you go off of mostly last year, then Price has to go above Weaver (and obviously Halladay) and even when you factor in track record, it’s not like Price is without one. You’d have to weigh track record pretty heavily to Halladay above Price which I thought went against the conceit of these lists.

My inclusions he didn’t list: Cain and Gonzalez

All in all, I know these lists are still just fun and filled with opinion (yes, even yours Shredder), but I can’t make sense of it sometimes when arguments supporting guys contradict where you rated them or others.

I’ve still got my reliever review upcoming and then the LF and RF lists are due this week before Friday night’s airings.

Monday: 01.21.2013

2013 Starting Pitcher Guide Announcement

title1

It is with great excitement that today I announce details regarding the 2013 Starting Pitcher Guide. This is the sixth year of the guide and it has grown exponentially since that first iteration which actually started on a message board (the now-defunct Rotojunkie.com which has morphed into RJ Bullpen). In the 2008 debut, I ranked 100 guys (or 112 if you consider “12 Under 30” add-on) in about 11,000 words growing to last year’s 400 player/76,000 word epic that spiked download count by 2x over 2011 and was even mentioned by Bill Simmons on his podcast. We’re ready for another step forward in 2013.

The first big piece of news related to the 2013 Guide is the addition of Doug Thorburn (Twitter) as a contributor. Doug is my colleague over at Baseball Prospectus and does some of the most amazing work on the site analyzing pitcher mechanics. He has also co-authored a book with Tom House on the mechanics of pitching. He has worked at the National Pitching Association (NPA), too, adding yet another impressive notch on his pitching resume (and those are just the highlights!). Both this 2008 interview with him at BP (before he started working there) and his latest article on Gio Gonzalez are free to view.

Take a look at the Gonzalez piece especially because that will give you a feel for what he will be contributing to the guide (and because it’s amazing). In addition to an essay on pitch mechanics to help us better understand them he will also be contributing a series of Mechanics Report Cards similar to the one you saw in the article. The report card list will be hand-selected by Doug with each team being represented by at least a couple players, though some teams will have a more robust offering. There will also be insight attached to the report cards crystalizing the information found within the card. We are still fleshing out some details, but this gives you a general idea and the one thing I can promise is that it will be awesome.

The next big news is the addition of bullpen coverage! Closers, for better or worse depending on your view, are a big part of fantasy baseball and having a firm handle on how to evaluate those who have a beat on the role as well as (and perhaps more importantly in some cases) those who might end up in the role can be extremely helpful to your success. It will also create an avenue to discuss the Middle Reliever Methodology that I have long been a fan of utilizing, especially in AL/NL-Only auction leagues.

Essays are returning to the 2013 guide! In 2011, the front of the guide contained a series of essays on various pitching-related topics, but they were absent a year ago. They are coming back with a vengeance this year with the only difference from 2011 being that I will be writing all of them (except for Doug’s pitching mechanics one, obviously). Topics will include strikeouts, prospects, bold predictions (often found here yearly, but this time tied to the guide), and park factors, plus much more. I have some other ideas, but they aren’t as set in stone so I’ll go with “plus much more” instead so you can dream about what might be included (you’re welcome!).

Projections are returning for 2013! Last year was my first attempt at putting together a projection set and it went well so I’m going to do it again this year. The ERA ranges will be used again spanning four to seven earned runs. I think it gives a better idea of what I’m expecting out of the pitcher, plus it covers a bit of luck on both ends. The ranges aren’t too wide over 185-200 innings and that’s another reason I do it. When you see 3.29-3.60, it feels quite significant, but it’s a seven run difference or one every five or so starts.

Of course this is all in addition to the player capsules you’ve grown accustomed to year in and year out. There isn’t a set number of capsules and there won’t be an announced number ahead of time so I don’t paint myself into an unnecessary corner by excluding someone to stay under an arbitrary round number. Instead, I’ll just say that it will likely be a number between 400 and 600. I have over 700 names on the initial list to be pared down as some situations became clearer and some low upside far-from-the-majors minor leaguers are eliminated.

Like last year, the focus will be on plentiful profiles of those with the most impact and upside, so Jason Hammel is going to get more attention than Carlos Martinez (Cardinals prospect at Double-A), but Martinez is going to get more attention than Nick Blackburn. Hammel is impacting 2013 and Martinez is impacting 2014 & beyond for dynasty/keeper leaguers. Blackburn, by costing the Twins $5.5 million dollars this year, is only impacting their ability to buy a free agent better than Kevin Correia. Blackburn isn’t even on the 40-man roster. That’s a foolproof sign that your signing has gone awry.

sp2

With the continued enhancements to a product you’ve hopefully already come to enjoy, we are moving to a very affordable pay model. The guide will available in late-February just in time for the fantasy season and is available for $12.

The guide comes via email in PDF form.

Order now!

btn_buynowCC_LG

Questions & comments can be directed to thespguide@gmail.com

Monday: 01.21.2013

2013 Starting Pitcher Guide Now Available

title1

Full details on the 2013 Starting Pitcher Guide

With the continued enhancements to a product you’ve hopefully already come to enjoy, we are moving to a very affordable pay model. You can order for $12! The guide, which comes via email in PDF form, is now available.

We now have a sample entry available for you to peruse so you have an idea of what you’re getting in the 2013 Guide. Click below to see both mine and Doug’s thoughts on Oakland A’s youngster, Jarrod ParkerDownload the Sample Here.

Available Now

btn_buynowCC_LG

Questions & comments can be directed to thespguide@gmail.com

Tuesday: 01.15.2013

Top 10 2B – Review

My DVR is more interested in doing what it wants rather than what I program it to do so I didn’t get a chance to watch the top 10 second basemen show over the weekend as it did not record Friday night. The replay schedule by the MLBN was odd as they re-showed the CF episode four or five times on Saturday and Sunday with no 2B replays thrown in. It is water under the proverbial bridge, though, since I have now seen it and I can present their lists to you compared to mine.

Harold Reynolds was the guest analyst and on Monday’s Clubhouse Confidential, we actually got a look at Brian Kenny’s personal list, too. As I mentioned in the CF post, Bill James is contributing his lists this year, too. Let’s start with MLBN’s machineamajig, The Shredder.

Shredder (my rank):

10. Daniel Murphy (UR)

9. Jason Kipnis (UR)

8. Howard Kendrick (6)

7. Neil Walker (8)

6. Dan Uggla (UR)

5. Brandon Phillips (4)

4. Ian Kinsler (5)

3. Chase Utley (9)

2. Dustin Pedroia (2)

1. Robinson Cano (1)

Three disagreements between my list and The Shredder, just like with the CF list. Jason Kipnis isn’t surprising as I mentioned how close he was to making my list, but ended up at 11 when it was all said and done. I’ll spoil something right here and tell you that this is the only one of the four MLBN-related lists with Daniel Murphy. He was never a consideration for me. He was really good in 2011 (in 109 games), but basically average in 2012. I think The Shredder was way off here.

Even though he wasn’t mentioned with Jose Altuve and Kipnis in my just-missed blurb, Dan Uggla was close. For me, there were just too many more complete players to find room for him especially as we get further and further away from his excellent 2010 season. His 2011 was salvaged by a big second half and the fact that his power was always there (career-high 36 HR), but last year he flopped again and only hit 19 homers.

Where the hell is Ben Zobrist? We know from the CF episode that they are considering where guys are slated to play for 2013 because they included Shin-Soo Choo on their list. And Zobrist actually played second base for 37 percent of his games last year with plenty of experience before 2012, too. Terrible omission.

Harold Reynolds (my rank):

10. Chase Utley (9)

9. Danny Espinosa (7)

8. Rickie Weeks (UR)

7. Aaron Hill (10)

6. Howard Kendrick (6)

5. Marco Scutaro (UR)

4. Ian Kinsler (5)

3. Dustin Pedroia (2)

2. Brandon Phillips (4)

1. Robinson Cano (1)

Only two differences between Reynolds and myself, should I be concerned? Ours were the only lists with Espinosa, too. We were more or less in lockstep on our agreements, too. I rarely agree with Reynolds’ ideas when he’s on Clubhouse Confidential or MLB Tonight so that’s why I find it so interesting how much we agree here.

Where the hell is Zobrist?

Bill James (my rank):

10. Dan Uggla (UR)

9. Rickie Weeks (UR)

8. Jason Kipnis (UR)

7. Aaron Hill (10)

6. Chase Utley (9)

5. Marco Scutaro (UR)

4. Brandon Phillips (4)

3. Ian Kinsler (5)

2. Dustin Pedroia (2)

1. Robinson Cano (1)

OK, I admit it, I should’ve had Kipnis on my list, but the Scutaro love is horribly short-sighted. I guess his great 61 games with San Francisco (plus playoffs) eliminate his terrible 95 with Colorado. Oh, and his entirely nondescript, below average decade of performance prior to 2012. The fifth best second baseman in baseball? I’m a big-time James guy, but that’s just bad.

There were grumblings throughout the show from just about everyone who appeared on it that second base is this wasteland, but I’m just not seeing it. I didn’t even have Kipnis, Altuve, R.Weeks, Uggla, Scutaro, or Murphy on my list let alone Darwin Barney, who is arguably the best defender at the position, and other capable guys like Omar Infante, Dustin Ackley, or Kelly Johnson who all deserve a modicum of consideration if we are putting Scutaro on the list. This is simply not a thin position.

Where the hell is Zobrist?

Brian Kenny (my rank):

10. Marco Scutaro (UR)

9. Brandon Phillips (4)

8. Rickie Weeks (UR)

7. Neil Walker (8)

6. Jason Kipnis (UR)

5. Aaron Hill (10)

4. Ian Kinsler (4)

3. Chase Utley (9)

2. Dustin Pedroia (2)

1. Robinson Cano (1)

Kenny let me down. I thought for sure he’d remedy the problem. Alas, where the hell is Zobrist? For someone as stats-oriented as Kenny who has touted Zobrist’s value in the advanced metrics, I’m surprised he missed him. There’s really no excuse for it from any of them. He wasn’t even mentioned on the show.

That’s a pretty aggressive ranking for Hill, but Kenny buys his 2012. He’s shown the power on more than one occasion before 2012 and the speed emerged in 2011 so it’s just a matter of whether he hits somewhere near his .302 from 2012 or the .225 he hit from 2010-2011. Obviously I liked a few guys more, but I don’t bring this up to quibble with it, rather to highlight it as a discussion point.

These lists caused some consternation among one All-Star second sacker and he took to Twitter to voice his concerns in a most-hilarious way:

I wonder if Phillips objects to my #4 ranking of him. I had him #3 initially, but eventually landed with Zobrist a bit higher. I was bummed to see Phillips’ walk rate tumble a full two percentage points as it really sliced into his OBP. If he had walked 44 times like he has the last three years on average, his OBP would’ve jumped from .321 to .346 and his output would look quite a bit better since he essentially matched everything else from 2011.

As I mentioned in the CF review, my SP and RP top 10s are coming up later this week to prepare for Friday’s shows.

Where the hell is Zobrist?

Monday: 01.14.2013

Top 10 CF – Review

I mentioned in the post with my centerfielder list that it would be a bit difficult because of the transition at the position. Should Mike Trout really qualify since he’s unlikely to play there much in 2013? How about Bryce Harper? I didn’t even really consider Shin-Soo Choo because he hasn’t yet played there for Cincinnati, but he was all over the MLBN lists. I love his bat, but his defense is a big fat TBD. For the record, I don’t think he’ll be abysmal or even bad. Probably just average.

Let’s take a look at how things shook out on the show.

Their primary list comes from The Shredder, which if you’ve watched Clubhouse Confidential at all (and you should be), you know is their device that churns out their projections and assessments of players based on the data. Sometimes not even Brian Kenny, their resident stats-guy, agrees with The Shredder and the former-ballplayer-turned-analyst never does. New twist this year is they get lists from Bill James, too!

Shredder (my rank):

10. Michael Bourn (3)

9. Adam Jones (7)

8. Jon Jay (NR)

7. Curtis Granderson (10)

6. Shin-Soo Choo (NR)

5. Jacoby Ellsbury (NR)

4. Austin Jackson (4)

3. Matt Kemp (5)

2. Andrew McCutchen (2)

1. Mike Trout (1)

Shredder matched seven of my selections including three perfect matches. It inexplicably had Bourn at 10 which led me to believe it isn’t counting defense all that much. I found that ranking patently absurd. Inclusions of Jay, Choo, and Ellsbury don’t bother one bit, but rating Bourn that low just doesn’t compute for me.

Jay is probably surprising to a lot of folks and it definitely raised my eyebrow when I saw him pop up about 6 minutes into the show, but upon further inspection, it’s not a bad selection at all. Just not over Bourn. Jay is 14th in fWAR the last two years for CFs and his 110 wRC+ is 10th ranked. He isn’t a power guy at all with just 14 homers the last two years, but his .301/.359/.412 is pretty strong, especially that .359 OBP.

Bill Ripken (my rank):

10. B.J. Upton (6)

9. Shin-Soo Choo (NR)

8. Curtis Granderson (10)

7. Michael Bourn (3)

6. Jacoby Ellsbury (NR)

5. Austin Jackson (4)

4. Matt Kemp (5)

3. Adam Jones (7)

2. Andrew McCutchen (2)

1. Mike Trout (1)

Maybe I’m overrating Bourn? Seven if better than 10, but I’m still surprised he’s rated out of the top five, especially from someone who is proud to ignore stats like Ripken. I figured he’d praise Bourn for “playing the game the right way”, moving the runner along, and his defense. He saved his praise for Jones who he feels will be an MVP candidate in 2013. At least Ripken got Upton in there. C’mon Shredder.

Bill James (my rank):

10. Angel Pagan (NR)

9. Michael Bourn (3)

8. Shin-Soo Choo (NR)

7. Austin Jackson (4)

6. Jacoby Ellsbury (NR)

5. Adam Jones (7)

4. Curtis Granderson (10)

3. Matt Kemp (5)

2. Mike Trout (1)

1. Andrew McCutchen (2)

OK fine, I’m overrating Bourn. Whatever! I don’t feel bad leaving out Ellsbury. I see an MVP-type season sandwiched around 92 terrible games the last three years. With the list being Top 10 RIGHT NOW, I can’t see how he has a very strong case, especially for the mid-list rankings he pulled on all three lists. Show me something, Jacoby.

Is it bad that Ripken and I had the most matches with eight? I matched seven apiece with The Shredder and James. Unique to my list were Harper at 9 and Denard Span at 8. Shredder went it alone with Jay, all 10 of Ripken’s appeared elsewhere, and James flew solo on Pagan.

I’ll do the 2B review soon and then SPs and RPs coming up later this week.

Monday: 01.7.2013

Yu Darvish’s 221 Strikeouts

Jason Cole over at Lone Star Dugout shared a fantastic YouTube video today on Facebook that shows the third strike of all of Yu Darvish’s 221 strikeouts (embedded at bottom, too, if you want to wait). It’s the perfect antidote to the winter malaise that baseball fans suffer, especially at this point when the Hot Stove has chilled as most of the biggest names have signed and trade rumors are in a lull. As an addendum to this brilliant video, here are some Yu-related strikeout stats:

  • Yu’s 10.4 K/9 was 2nd in MLB (Max Scherzer 11.1) among qualified starters.

  • Yu’s 10.4 K/9 was 4th in MLB history for qualified rookies (Kerry Wood 12.6, Doc Gooden 11.4, Hideo Nomo 11.1).

  • Yu’s 27 percent strikeout rate was 2nd in MLB behind Scherzer’s 29 percent mark.

  • Yu’s 27 percent strikeout rate is 4th best among qualified (162+ IP) rookies behind the same three from the second entry. All three of those guys fanned 30 percent or more including Wood’s filthy 33.3 percent mark.

  • Yu’s 221 strikeouts were 7th in MLB despite the fact that both he and Scherzer didn’t even eclipse 200 innings, let alone the 227 that the other five (Justin Verlander, R.A. Dickey, Clayton Kershaw, Felix Hernandez, and James Shields) all reached or exceeded.

  • Yu’s 221 strikeouts rank 6th among rookies behind Gooden (276), Herb Score (245), Nomo (236), Wood (233 in 167 IP!), and Pete Alexander (227). Alexander needed exactly 200 more innings to finish six strikeouts behind Wood.

  • Yu’s 221 strikeouts mark just 9th time a pitcher has achieved more than 220 strikeouts in fewer than 200 innings. Both he and Scherzer achieved the feat this year (231 in 187.7 IP) and they join Oliver Perez (239 in 196), Nomo (236 in 191.3), Wood (233 in 166.7), Sam McDowell (225 in 194.3), David Cone (222 in 195), Erik Bedard (221 in 182), and Nomo again (220 in 198). All but McDowell occurred in the last 18 years. McDowell pulled it off in 1966 when he and Dave Boswell blew the field away at 10.4 and 9.2 K/9, respectively, while Mickey Lolich finished a very distant third at 7.6 K/9.

  • Yu’s 192 strikeouts on a swinging strike were 1st in MLB just ahead of Scherzer at 189. Dickey (187) and Verlander (181) joined them as the only four to top 175. It is the 6th best mark in the last four years (as far as the data goes) behind Clayton Kershaw’s 200 in 2011 and four guys in 2009: Tim Lincecum (205), Verlander (202), Javier Vazquez (202), and Zack Grienke (194).

  • Yu’s 59 three-pitch strikeouts were 1st in the American League and 3rd overall behind Cliff Lee’s 70 and Dickey’s 62.

  • Yu’s 50 percent strikeout rate in two-strike plate appearances was 1st in the American League and tied for 2nd in MLB behind teammates Stephen Strasburg (52%) and Gio Gonzalez (50%).

  • Yu’s 29 percent whiff rate is the 2nd best in baseball behind Rich Harden’s 30 percent mark since 2007 according to this Brooks Baseball/BP chart. Harden’s figure is made more impressive when you realize that it is a composite mark for 2007-2011.

  • Yu’s 28 percent whiff rate on fourseam fastballs is the best during that span with a minimum of 500 heaters thrown. The chart can be viewed in detail here.

  • Yu wiggled out of 36 three-ball counts for strikeouts which was good for 2nd best in the American League behind Verlander (43) and 9th overall behind Yovani Gallardo (49), Greinke (44), Cole Hamels (43), Gonzalez (42), Matt Cain (38), Madison Bumgarner (38), and Kershaw (37).

  • Yu’s 21 percent wiggle-out rate (strikeouts in three-ball PAs) was tied for the 7th-highest in MLB with Hamels dominating the field at 31 percent. There are 14 pitchers Yu and Hamels with several ties include two at 25 percent, three at 24, and seven at 22 along with solo entries at 28 and 23.

  • Yu’s 122 strikeouts out of the strike zone were 5th best in baseball behind Hernandez (142), Greinke (136), Shields (132), and CC Sabathia (124).

  • Yu got 116 of those 122 strikeouts on swing-and-misses, good for 2nd best in baseball behind Hernandez at 128.

  • Yu is awesome.

It figures that my first post of 2013 would be about a badass strikeout pitcher. For those curious, I have finished my work on the Baseball Prospectus 2013 Annual so I’ve turned my full attention to the 2013 Starting Pitcher Guide. I’ll have news on that soon. In the meantime, my fall/winter slumber here is officially done with this post so expect regular content to return even as I work on the guide.

Here is the Yu video if you don’t want to click the link at the beginning of the post:

Friday: 12.14.2012

Josh Hamilton in Offensively-Challenged Los Angeles

Josh Hamilton signed a surprise five year deal with the Los Angeles Angels worth $125 million dollars as they hope to out-hit their opponents on the heels of losing two important cogs from their rotation in Dan Haren and Zack Greinke. Forecasting a player’s career is one of the toughest things to do even when you have a guy who appears to be growing linearly at each level in the minors and then as a major leaguer. When you take one of the most unique cases ever like Hamilton, it gets a helluva lot harder, so I’m going to punt to a degree.

To guess how his body will age after what he put it through contains so much guesswork that it’s not even really worth it. Virtually every player has some sort of comparable within history to rely on or at least seek guidance from, but not Hamilton. Instead, let’s focus on the biggest change for Hamilton: his home ballpark. I think that will have a major effect on his production as he leaves one of the best ballparks in the game and enters a sneaky-tough one.

HamiltonTexRoad

To the surprise of nobody, I hope, Hamilton does significantly better at the Ballpark in Arlington. Part of that is because virtually every player does better at home (unless you play in cavernous confines like Petco Park) and more importantly because TBIA is a very favorable park for hitters. It rated in favor of hitters across all major categories including 4th in runs according to ESPN Park Factors. Baseball-Reference does composite park factors, one for batters and one for pitchers, where over 100 favors batters. Texas hasn’t been under 100 on either side of the ledger since 1994. In other words, it’s a hitter’s paradise.

And still a third outlet gets to the heart of how much Hamilton enjoyed his home park. Stat Corner shows park factors by batter handedness and they show Texas with a 117 home run factor for lefties. The same goes for doubles and triples while singles are still favorable at 103. Again, 100 is even so lefty batters get a 17 percent advantage on home runs in Texas. Just for a point of reference, we all know Yankee Stadium offers a very generous home run edge to lefties because we see it with our eyes every night, but the numbers back it up as well with a 146 factor. Keep in mind that these numbers from Stat Corner are three-year rolling averages.

So that is what he is leaving behind.

We saw in the figure above that he is still a mighty capable hitter elsewhere. If you average the home run and RBI totals over his average plate appearance count the last three years (582), he’s a 27-89 guy. So .294 average, 870 OPS, 27 home runs and 89 RBIs? That’s basically Andrew McCutchen the last three years. McCutchen’s 863 OPS is the closest match to Hamilton’s road numbers over the last three years. I used three years to approximate the plate appearances. Cutch had 2004 in that span.

Next closest was Evan Longoria, but I had to drop the plate appearance threshold to 1500. Longo has an 872 OPS in 1547 plate appearances as his 2011 and 2012 were injury-shortened. I’m not using these two as comps, rather using them to show what an 870 OPS guy looks like. The problem with using these two is their trajectories are a lot different than Hamilton. We can’t just expect Hamilton to put up a reasonable facsimile of his road work with the Angels because that doesn’t factor in his career trajectory or aging. Nor does it take into account the fact that he will be playing 81 games in Angels Stadium. That might actually be more important than anything his body does, at least in the short-term.

Going through our resources again, we see that ESPN had Angels Stadium as the 4th-worst for runs scored and they didn’t register a favorable mark for hitters in any of the major categories, except for triples which isn’t exactly a major part of Hamilton’s game. In fact, they were 4th-worst for hits in general, 6th-worst for home runs, 8th-worst for doubles, and 17th-worst for triples. Baseball-Reference shows that they’ve gone from neutral/slightly pitcher’s park to heavy pitcher’s park just recently posting 92 batter and pitcher park factors each of the past two seasons.

Digging deeper with our third resource shows the real trouble. Or at least, potential trouble. Stat Corner given Angels Stadium a home run park factor of just 82 for left-handed batters! In other words, that park is suppressing lefty longballs 18 percent more than a “normal” park. Remember he was getting a 17 percent advantage in Arlington so this move constitutes a potential 35 percent dip in home run production for 81 of his games. His new ballpark also stifles double/triples to the tune of a 92 park factor while it is essentially neutral on singles with a 99 factor. Adding to chorus, Brian Cartwright, creator of Oliver, confirmed what we saw from Stat Corner.

How has Hamilton done in these confines through his career thus far? Glad you asked. Obviously with Rangers he has had plenty of exposure (his 166 PA there are his second-most in any park) to the ballpark, though it hasn’t exactly gone well on the whole. He has a .260/.325/.440 line with five home runs, 19 RBIs, 8 percent walk rate, and 17 percent strikeout rate in Anaheim. The story is bit different when you look at the five slices of the pie that make up these numbers, but does it tell us anything?

HamiltonLAbyYrThere is a small sample size alert in effect for the entire 166 plate appearances, so of course any one of the five slices receives the same alert, even louder to be honest. It is at least somewhat interesting that the composite is really brought down by a rough go in LA this past year. The Angels completely shut him down. To that point, he’d put together a .287/.367/.500 line in 128 plate appearances. Of course his big problem from 2012 at large rears its head here, too. His strikeout rate was enormous in Los Angeles last year just as it was with a career-worst 26 percent rate for the year. If that trend continues, his work in LA prior to 2012 won’t matter because the overwhelming swing-and-miss will continue to eat into his production.

I don’t necessarily expect him to crumble into a league average player because of his home park, but the impact should be significant even though he won’t be facing the Angels pitching anymore. He hasn’t really enjoyed success in any of the renowned pitcher’s parks in the American League where he has something of a sample (70+ plate appearances) except Cleveland.

HamiltonPitchParks

I’ll reiterate again that these are all small samples. I’m not disclosing that so they can be ignored, just to point that I’m not putting an egregious amount of weight into them and you shouldn’t either as I’m sure many great players struggle in these parks. Conversely, they aren’t entirely meaningless either. In other words: the mean a lil’ somethin’. And let’s keep in mind that he has 18 games in the top two venues. So that’s 99 games in three venues where he hasn’t posted better than a 765 OPS for his career.

It should be noted that he will get a benefit of 18 games in the state of Texas to pad the road numbers we saw at the very beginning. He’s removing the LA ones and replacing them with nine in Arlington and nine in the home of the new AL West foe, Houston. He has been remarkably successful in Houston no doubt due to both the park and the fact that they haven’t exactly been awesome of late. Nor will they be in 2013, so that should continue. He has a .344/.400/.525 line with seven extra-base hits including a pair of home runs and nine RBIs in 70 plate appearances.

Where does all of this leave us?

Barring some serious changes from what we’ve seen to date, Hamilton’s production is a virtual lock to decrease and not just marginally.  As far as the contract goes, the baseball community has wins valued at about $5 million dollars per meaning Hamilton would have to be a five win player on average over the life of the contract to “earn” it. Of course there is other value to bringing in someone like Hamilton (listed lowest to highest, IMO) in terms of attendance, apparel sales, potential playoff earnings, etc… I honestly don’t believe I have the capability to calculate the exact impact for all of them, but I think you could reasonably slice a win per year ($5 million) off of “expectation” and it wouldn’t be completely out of bounds. In other words, I don’t think owner Arte Moreno and GM Jerry DiPoto signed this deal saying, “we absolutely, unequivocally think Hamilton will deliver 25+ wins during these five years, so we’ll go ahead and do this deal!” They are hoping for star-level production for the first two-three years resulting in no worse than some playoff appearances and ideally a title. If that occurs, they’ll consider the deal a success.

Slicing off the win from his expectation would then mean he has to be a 4.0 win player for five years, or net 20 wins however he wants to disperse them. Considering that his most favorable of the three win metrics (fWAR, rWAR, & WARP) was at Fangraphs and he was still “only” a 4.4 win player with an amazing year at the dish, I think he will be hard-pressed to fully “earn” the contract from a wins standpoint, at least in terms of how we calculate wins in the sabermetrics community. A lot of that seemingly low (when you consider his offensive output) win total from last year (btw, his rWAR was 3.4 & WARP was 3.9) is because he was a net negative in the field. Will he get better moving back to a corner outfield spot? Even if he does, will his bat stay on par with 2012 so that he’s then a 4-5 win player?

In a word: no. I just can’t see it happening. Hamilton is one of the most talented players in all of baseball so no one would lose their minds if he chased down a 1000 OPS again, but that would be an upset and fantasy folks should probably forget about the days of Hamilton’s MVP season (1044 OPS) and last year (930 OPS), instead focusing on his 2011 as a potential peak (882 OPS). The power output could be stunted to sub-30 levels, too. He hit 58 percent of his home runs in Arlington from the last years (that also happened to be 58 home runs as he hit exactly 100). He will struggle to keep that record going in Angels Stadium.

And again, all of this doesn’t even begin to try to factor his aging curve and his past troubles with drug addiction will play in his mid-30s. Hamilton is still a star-caliber player, but not necessarily superstar-caliber in his new digs so if your league doesn’t allow a discount for his switch in home ballparks, then bow out immediately. Tread cautiously.
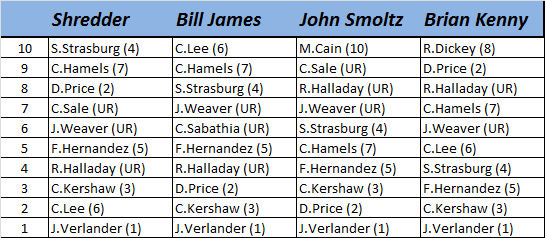