Archive for February, 2013

Friday: 02.8.2013

Top 10 Third Basemen Right Now

Tonight MLB Network will continue the 2013 iteration of their “Top 10 Right Now” series at each position capped off with a “Top 100 Overall”. They will air both the third base and shortstop shows on Friday evening. I always enjoy this series and generally look forward to it after the New Year since I eat up just about any fresh baseball content I can as we wait for pitchers & catchers to report. Instead of putting up my lists after they air their selections, I’ll post mine ahead of time and then compare notes after the shows air.

This is not a fantasy list!!

Both Kyle Seager and Brett Lawrie were heavily considered, but in the end they had to be left off this year. I think both will take a step forward in 2013, but not enough to merit a spot. Seager specifically has to combat Safeco Field where he was 200 OPS points worse last year (632 to 835) and I’m not sure the moved fences are going to make that much of a difference. Lawrie was just edged out by #10.

THE LIST

10. Pablo Sandoval (SF) – Two straight years shortened by injury is worrisome, but he looked plenty healthy in the World Series (that jerk!).

9. David Freese (StL) – More than adequately followed up the World Series generated hype with his best season yet. It also happened to be his first full season. There probably isn’t much growth left at 30 years old, but he should sustain in 2013.

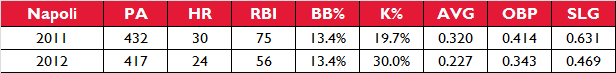
8. Chase Headley (SD) – A jump from 4 to 31 home runs is excellent, but how sustainable is it? The power surge came out of nowhere, but Headley as a remarkably talented player isn’t new. He completely understands what Seager is dealing with in Safeco.

7. Martin Prado (ARI) – He was inexplicably included in MLBN’s LF list given the precedent they set with Shin-Soo Choo as he will be a third baseman this year with the D’Backs. A bit underrated because he doesn’t do any one thing extremely well, but instead holds his own in every facet of the game adding up to a damn fine player.

6. Ryan Zimmerman (WAS) – Essentially lost the first three months to injury. Sure, he was playing, but he wasn’t himself carrying a sub-700 OPS through June and even a week into July. That he ended at 824 tells you how great he was the rest of the way.

5. Aramis Ramirez (MIL) – One of the more underrated players in the game in my opinion. He is a fantastic hitter who has been below league average just twice since becoming a full-time player in 2001. He’s a capable third baseman, too.

4. David Wright (NYM) – Simply one of the best in the game. He does it all and he’s still just 30. He really cut into his strikeout rate last year, too, hopefully that’s a skill that has returned because the three years of 20+ percent wasn’t serving him too well.

3. Evan Longoria (TB) – We know he’s a superstar, we’ve seen it, but we haven’t seen that transcendent year yet as his last two have been cut short by injuries. It’s coming.

2. Adrian Beltre (TEX) – It’s so close, but his defense doesn’t do enough to make up the gap between he and #1. My little love letter to him was part of the Spring Training Countdown.

1. Miguel Cabrera (DET) – Far from the best defender at the position, but easily the best hitter. Plus he wasn’t the overwhelming disaster on defense that most people expected. There may be no finer hitter in all of baseball.

What do you think? Any major misses?

Friday: 02.8.2013

Top 10 C – Review

Last Friday night, MLB Network unleashed their Top 10 First Basemen Right Now along with input from host Brian Kenny, former MLB catcher Dave Valle, and special guest Bill James. There was no list from Kenny this time around because he usually shares his on his show Clubhouse Confidential and unless I missed an episode, I haven’t seen one from him. So we’ve got the two guests and The Shredder, which is MLBN’s “objective” system that allegedly just uses the raw data of recent history to project 2013. The Starting Pitcher list for 2013 told me all I needed to know about its objectivity, though. There’s no way it’s simply processing data to come up with its list.

Here are all three lists from MLB Network-related folks and then I’ll address them separately:

top10Clists

The Shredder

There is no real way to justify Carlos Ruiz at three prior to his offseason news, but then when you factor in his 25-game suspension, it just makes no sense. As with first base, there isn’t too much disagreement among the actual guys who belong in the top 10, just slotting. At some positions, I had three or four different than some of the lists, but the max is two at catcher. I guess I shouldn’t be surprised that Buster Posey swept first place, but he really shouldn’t have since we are judging the best catcher. Yadier Molina is a significantly better catcher than Posey and he played nearly 200 more innings at the position than him. Posey outdid him offensively, but part of that advantage is mitigated by the fact that he played 29 games at first (and raked). In fairness, he still outhit Yadi in his catcher-only numbers, but that’s where the defense comes in.

Salvador Perez at six and more importantly ahead of Matt Wieters makes little sense to me, too. Wieters hasn’t hit like we expected when he was in the minors, but he’s better than Perez at this juncture.

My inclusion they didn’t have: Brian McCann

Dave Valle

I thought he too overrated Ruiz and not including Carlos Santana annoyed me a bit (though he isn’t particularly good at actually catching which I’m sure bothers Valle a good bit as a former catcher himself), but NO JOE MAUER???? Not at all? OK, his caught stealing rate was awful this year at 14 percent and he only played half of his games at catcher, but doesn’t the offense as a catcher at least merit a top 10 slotting?

My inclusions he didn’t have: Mauer, Santana

Bill James

This might be the first James list that didn’t have at least one head-scratcher selection. Well actually, A.J. Pierzynski is pretty close to that. He’s terrible at catching and James of all people can’t possibly believe his 2012 is a new level of performance that will be maintained. And he obviously cares about defense because I’m assuming Ryan Hanigan’s MLB-best 48 percent CS rate is the only reason he made the list.

My inclusions he didn’t have: Perez, Alex Avila

Thursday: 02.7.2013

Countdown to Spring Training: 15 Days – Ryan Doumit

Only 15 days until live game action…

The backend of the doubleheader to catch up from yesterday’s missed piece and as I mentioned in the Napoli piece, I’m hoping to get several done this weekend to avoid any more delays as we head into the second half of the countdown.

RYAN DOUMIT

For years, fantasy managers would always wonder aloud “what if Ryan Doumit just stayed healthy one year and got 500+ plate appearances?” We finally know the answer. In 2012, he had a career-high 528 PA and put together a .275/.320/.461 line with 18 home runs and 75 RBIs, in other words he did exactly what we should’ve expected once extrapolating his previous numbers out over 500 PA.

The extrapolation game is dangerous with small samples, but after a while Doumit’s several similar small samples became a large body of work. Only twice in his seven seasons before 2012 did he top 450 PA with the other five yielding 304 or fewer each time. His triple slash stats bounced around a bit as he hit .318 one year and .208 in another, enjoyed a .357 OBP one year and .299 the next, and even had a .501 slugging percentage only to fall to .406 two years later (the .318/.357/.501 are all from his 2008 season).

Through it all, his 528 PA pace (number equals his 2012 total) in homers and RBIs was just about the same:

doumit

While not really a catcher in the conventional sense, he has maintained eligibility behind the dish throughout his career giving him a special appeal to fantasy managers. Offensive upside at catcher often costs a pretty penny and in 2008-2009 so did Doumit. He had an 813 OPS in 2007 leading to a high price tag in the spring of 2008. He backed it up with the season of his career which sent his price sky high heading into 2009. He tanked. He tanked hard. Ever since then, he’s been kind of an afterthought with most resigning to the fact that he’s just never going to play enough.

His value was always in his catcher eligibility, but at his value peak the tantalizing thing about him was the fact that he was only a part-time catcher – playing first and outfield as well – so if he could stay healthy he could rack up the playing time that other catchers wouldn’t since he didn’t need so many off days. That finally came to fruition in his eighth year in the majors.

He started at catcher 56 times, but also logged starts as a DH (48), LF (16), and RF (6). He got some time at first base in one game, too. Can he repeat? At 32 years old, can he log a 500+ PA season, a feat that eluded him for seven years, for the second straight season? The smart money is on “no”. I like smart money. I’m even more likely to avoid the bet this year because the price is once again on the high side. His current NFBC ADP is 170th overall.

I’d rather wait 60 picks and take Alex Avila.

Thursday: 02.7.2013

Top 10 1B – Review

Last Friday night, MLB Network unleashed their Top 10 First Basemen Right Now along with input from host Brian Kenny, former MLB first baseman Sean Casey, and special guest Bill James. Throughout the series, I’ve had some issues with their inconsistency regarding guys with multi-eligibility. I felt they set a precedent with the initial show by placing Shin-Soo Choo among the centerfielders. That will be his 2013 position so I figured that’s how they’d operate moving forward, but instead they’ve been all over the map.

There were no such issues at first base. In fact, there was very little disagreement among which 10 players should be included. Rankings were different, but I only had one difference with three of the four lists and just two with the fourth.

Here are all four lists from MLB Network-related folks and then I’ll address them separately:

top101Blists

The Shredder

My only real issue here is that Mark Teixeira is a bit high for me. I’m sure it’s the reputation of his exemplary glove. And it is good, but his bat is now one dimensional as he has become a .250ish hitter. His walk rate is on a 3-year downswing, too, eating into his OBP. He’s just not the superstar he once was back in his mid-20s. I was thrilled to see my boy Allen Craig get so much love. In fact, this is lowest he was rated besides my #9 ranking. I think I was trying to self-censor myself and make sure I didn’t overrate him.

My inclusion they didn’t list: Freddie Freeman

Sean Casey

This might be the best list of the entire series! Of course I only say that because it is arguably the most similar to mine that we’ve seen. We matched our top four and the only big divergence was that he rated Craig much higher which of course I’m more than OK with. Adam LaRoche over Freeman is completely defensible.

My inclusion he didn’t list: Freeman

Bill James

I’ve had the biggest issues with James’ lists throughout this series. I think he’s made some terrible picks and knowing his background, I can’t figure out how he’s coming to the conclusions. First base was no different. Anthony Rizzo is really better than Edwin Encarnacion and Craig? After 87 games? Really, Bill? C’mon. How on earth is Joey Votto third? This is just one of those where it’s not really an opinion thing. All of the data, which you’d think he favors, points to Votto easily being the best 1B right now. I was pretty geeked when I saw that James was going to be a part of the series, but it’s been a total dud for me. His reasoning is often shoddy (again, massively surprising given who we are talking about here) and he’s just all over the map.

My inclusion he didn’t list: Craig and EE … seriously, c’mon Bill.

Brian Kenny

He listed Craig fourth. He wins life!

My inclusion he didn’t list: Freeman


Thursday: 02.7.2013

Countdown to Spring Training: 16 Days – Mike Napoli

Only 16 days until live game action…

Got some make-up work to do! Wednesday was really busy and all of a sudden it was 11:42 PM and clear that I wasn’t going to finish this piece. Hopefully I will be able to get some Top 10 Right Now stuff done today, too, so I don’t have the same issue I had last week.

MIKE NAPOLI

Back in 2004-2005, Mike Napoli hit a combined 60 home runs with 217 RBIs, 190 runs scored, and 21 stolen bases as a catcher in the Los Angeles Angels system. Unfortunately he wasn’t really much of a catcher behind the dish. This would prove to be a problem given his big league manager, former Dodgers catcher Mike Scioscia. Scioscia takes defense behind the plate very seriously so he wasn’t likely to be nearly as enchanted with his three true outcomes catcher as were the fans and fantasy baseball managers.

He debuted in 2006 doing what he does best: rip bombs (16), walk (51), and strikeout (90). All in 325 plate appearances over 90 games. Though he hit a meager .228, his .360 on-base percentage more than made up for it. The next year was more of the same, but in just 75 games. Then 2008 was the best of the bunch. He started a string of 20-homer seasons while also posting a career-best .586 slugging percentage and adding some batting average to a much more palatable .273 mark, but in just 78 games. The “Free Napoli” campaigns were under way by this point. He was on a 36 homer pace over 500 plate appearances.

Fast forward three years.

He played 114 and 140 games during his final two years with the Angels, but he was traded during the offseason following 2010 first to Toronto in that awesome Vernon Wells deal and then four days later to Texas. Finally. It worth noting that not all of time missed was at the hands of Scioscia. Injuries played a role as he had two DL stints in 2007 and another in 2008. In that 2010 season before leaving LA, he’d finally been given a full season (his only 500+ PA season to date) and he was solid, but not special. His walk rate plummeted to a career-worst eight percent while his 27 percent strikeout rate was the second-worst of his career. The trade was almost inevitable.

Staying in Toronto would’ve been perfectly fine, but moving to Texas whetted the appetite of every fantasy baseball manager in the world. What could he do in that park? A lot, it would turn out, but he was hardly feasting on his home venue Coors Field-style. He was actually better on the road that year with 13 homers and a 1011 OPS in Arlington and 17/1078 on the road. He didn’t stay upright as long as in 2010 missing nearly a month to a strained oblique, but he hit 30 home runs for the first time and posting career-best strikeout and walk rates. The most surprising piece of his 2011 was the .320 average. Everyone would’ve bet on 50 home runs before .320.

The follow up wasn’t quite as sweet. To hear some tell it, you’d think he hit eight home runs in 400+ PAs with a .198 batting average. It wasn’t nearly as bad as it is portrayed at some outlets. Coming from 2011’s peak, it was definitely a tumble, but how bad are we really talking about here?

napoli1

The singular difference in those two lines seems to explain everything. Elevating your strikeout rate by 10.3 percent is never a good idea and it will unquestionably cut down the production from the previous year if everything remains the same. How different were these two seasons compared to what he was averaging coming into 2011? I gave the raw averages, but then scaled them to 425 PA to better compare them with 2011-2012.

napoli2

This is more or less the same as 2012 save a sharp difference in strikeout rate. At this point, it is becoming quite clear that 2011 was the outlier. Most fantasy managers knew this deep down, but in their hearts they wanted to believe he could maintain the level now that he was playing in such a hitter-friendly environment and delivering such incredible value as a catcher. Of course the similarities in his numbers aren’t surprising when you look at his remarkably consistent batted ball profile.

napoli3

Only the HR/FB rate and that coincides with moving to Texas. So again, the only significant difference between his 2011 and 2012 seasons is how often he struck out. In 2011, he was striking out far less and it was translating into bundles of hits. In 2012, regression hit hard and actually zoomed by his career rates into a new low.

Diving deeper into his numbers, we see that off-speed pitches ate him alive in 2012, a 180-degree difference from 2011. Was this injury-related? In 2012 Napoli was day-to-day with a head injury, an illness, and twice with quadriceps injuries until the strained left quad finally DL’d him for a month in August.

napoli4

If you didn’t know any better, I could convince you that those are the numbers of two different players. The 2012 performance against off-speed stuff isn’t congruent with the 2009-2010 Napoli, either. Those 2012 numbers add up to a 582 OPS with a 43.5 percent strikeout rate, compared to 757 OPS and 30.8 percent in 2009-2010. Yet again the 2011 performance of 908 OPS and 26.7 percent is a major outlier by comparison.

Where does all of this leave us? If he didn’t have a degenerative hip issue that cost him two years and $34 million dollars from his initial deal with the Red Sox that eventually became a one year, $5 million dollar pact, it wouldn’t be too hard to project that a healthy Napoli improves significantly on his 2012 as his strikeout rate regresses toward previously established levels. The problem is determining the likelihood of a healthy Napoli. Unfortunately, it’s a pretty big unknown making it difficult to value him for 2013.

How much risk can you stomach? His current NFBC average draft position is 104, or the seventh round (NFBC uses 15-team leagues). I personally cannot stomach that much risk. Even if this were normal Napoli and not Nahipoli (please shoot me for that one), you are still talking about a guy who has one 500+ PA season and a peak of 432 otherwise. There is seemingly always something amiss with his body so adding a balky hip that we already know is a mess muddies the waters enough for me to pass altogether. It helps that he likely won’t be catching at all to exacerbate his injuries issues, but even still he won’t be on any of my 2013 teams at this current cost. I’d rather Alex Avila 126 picks later.

Wednesday: 02.6.2013

Double Dose of Countdown on Thursday

Busy, busy schedule on Wednesday pushed the Mike Napoli entry back. Let’s play two on Thursday instead. I’m hoping to get a handful of entries done over the weekend so we can prevent future delays.

Tuesday: 02.5.2013

Countdown to Spring Training: 17 Days – Alex Gordon

Only 17 days until live game action…

With 30 days to go, I started profiling a hitter per day highlighting one from each team. I selected my player of note from each team and then randomized them (which was pretty interesting consider who the final two were after the randomization) so that’s the order I’ll be following.

Just under the wire! It’s still Tuesday for me. I went to dinner with my podcast co-host and long-time friend Jason Collette and I was pumping out SP Guide work all afternoon so the Countdown got short shrift until after dinner.

Stupid sidenote: the last four Countdown entrants have first names that start with “A”. Isn’t your life better now?

ALEX GORDON

Drafted with the second overall pick in 2005, Alex Gordon was tabbed as the savior of the franchise almost immediately. He was a mix of George Brett, Ryan Gosling (not yet a mega-star, but he’d done The Notebook so throwing him into the mix was betting on the come back then), and a unicorn. He started his pro career in Double-A and obliterated the league in 2006 vaulting himself to the top of the prospect heap heading into 2007 according to Kevin Goldstein and #2 overall according to Baseball America.

He wasn’t even Gosling circa “Are You Afraid of the Dark?” posting an uninspired .247/.314/.411 line in 601 plate appearances. It got better in 2008, but only because he had set the bar so low. Things actually got worse in 2009-2010 resulting in trips back to the minors in each season where he ended playing 30 and 75 games, respectively, split across a few levels. A hip injury in 2009 cost him three months and that was sandwiched by quadriceps and thumb injuries in 2008 and 2010 that both required time on the disabled list. He was not only failing to live up to the lofty expectations, but through 2010 it was hard not to see him as a bust. He’d had a career 95 OPS+ in 1642 PA.

It all turned around in 2011. He finally stayed healthy again and not only had his best season yet (not a difficult feat given what he’d done to date), but also had a legitimate star-level season. He registered a 7.1 bWAR and 6.9 fWAR in his first full season as a leftfielder, having switched over from third base. He proved to be not only adequate out in left, but exemplary as his 12 kills doubled the next best from a leftfielder (Gerardo Parra, 6) and led all of baseball as he narrowly edged teammate Jeff Francoeur by one.

Finally.

Last year’s follow was a bit off the pace, about a full win at both sites, but still a star level offering. Gordon has hit .298/.372/.478 the past two years in 1411 PA with 37 home runs and 96 doubles, including an MLB-best 51 last year. Are his 37 home runs a disappointment? When he was expected to become Georygos Brettunicornling, I think many were looking at 30 bombs a year. Brett only averaged 17 during his career with a 162-game average of 20, but he never struck out (career 7.8% K rate) so Gordon was supposed to trade those Ks for more homers. It took Brett 9196 PA to strikeout out 634 times; Gordon has fanned 641 times in 3053 PA. Different eras and Gordon isn’t Brett so I’m not holding him to that standard, just showing the incredible gap.

In the midst of his prime at age-29 with back-to-back seasons of 45 and 51 doubles, some are still expecting a home outburst as there is an adage that believes a player with a ton of doubles could start translating some of them into home runs with some added strength and/or a bit of good fortune. The thinking being that with 45+ doubles, several are banging off the wall and just missing their exit from the yard. It’s not a terrible notion, but it’s not a birthright if you are a big doubles hitter, either.

Looking at Gordon’s 2011 with 45 doubles and 23 home runs, there are 79 players with seasons of 45+ and 23 or fewer, but only 12 others including Gordon to have pulled off the feat more than once.

gordon1

Hey, it’s George Brett! Gordon is fulfilling the expectation after all! What does this group of players have in common? They never really translated the doubles into an abundance of home runs. Brett’s 30 in 1985 are highest of anyone in that group and he didn’t do it after either of his 45 double seasons. The second name on that list is the one that rings truest when I think about Gordon.

In fact, when I was making my list of which players I wanted to cover for the countdown, I was thinking about Gordon and trying to come up with who he reminded me of after his two big seasons in a row and I kept coming back to Nick Markakis and Shin-Soo Choo. There is nothing with that as both as high quality MLB players. Markakis had run off six straight full season of well above average play (117 OPS+) before being limited to just 104 games last year.

The bottom is that the home runs aren’t coming, not at the quantity that was expected of him as a prospect. He’s going to live in the 15-20 range and may have another season or two where he pushed 25, but barring a major change in his approach, 30 just isn’t happening. He is the prototypical line drive hitter with gap-to-gap power. His line drive rate hit a career-high at 25 percent last year and has lived at or north of 20 for his entire career save that 2009 washout. His flyball rate is on a four year decline hitting a nadir of 32.7 percent a year ago, a far cry from his career-best 47.6 back in 2008.

After spending 172 of his last 312 games as a leadoff hitter, he is currently slated to hit third again with Lorenzo Cain leading off. Hopefully this switch doesn’t prompt Gordon to unnecessarily change his approach thinking he has to be “the man” and go for power in that spot. His work in the 3-hole has been 101 points worse from an OPS standpoint than his leadoff work (883 to 782) and 64 points worse in slugging percentage (.501 to .437).

He needs to stick with his approach from 2011-2012. The move to third in the batting order puts 100+ RBIs into play even if he only hits 14 home runs again. That would be a career high by 13 RBI (2011). Meanwhile he could still score 100 as he did in 2011 (101) provided he maintains or improves his 10 percent walk rate. I think he still viewed as an overall disappointment by some which depresses his fantasy price. Current NFBC draft data has him as the 94th guy off the board, inexplicably behind teammate Eric Hosmer. Don’t be afraid to pay for Gordon, especially at this current discounted rate, but even for a little more should your league price him higher. What he lacks in home run power, he makes up in batting average and runs scored, the two most underrated categories in standard 5×5 leagues.

Monday: 02.4.2013

Chris Carter Addendum

Earlier today after he was dealt to Houston, I did a piece on Chris Carter and how his power should spike with his new home ballpark. I used the Katron.org balls in play information to outline three batted balls from Carter that would’ve been home runs in Minute Maid Park. It was meant to accentuate the point regarding his likely power improvements in his much friendly environs, but it was greatly flawed. You see, the Katron dots are where the ball is fielded not where it landed. I knew this in the recesses of my mind, but I never gave full thought to the notion and what it means when analyzing this kind of data.

Here is the legend for the Katron data:

katronkey

The problem comes in that we don’t know the hit type of singles, doubles, triples, and home runs. So I absent-mindedly assumed (never assume, kids) that the doubles were hit in the air either as line drives or flies. They were not. After getting some education about Katron and the potential flaws with using the data as I did, I went back to the video and found out that my particular examples show just how dangerous using the data as I did can be when the dots represent where the ball is fielded and not where it first hits the ground.

First, let’s look at the doubles:

ccarter1a

ccarter2a

See the problem now? I apologize for that, I simply didn’t put together the inherent flaws of using the data like that. It’s 100% my fault, though, so I’m not crapping on the folks over at Katron.org as it’s even there in bold below the charts:

Every location is where the ball was fielded by a player, not where it landed. You better read this Paul Sporer you stupid dummy. 

That may not be a fully accurate quote from their site.

Perhaps if I had been reading my now-BP-colleague Sam Miller a year ago when he was writing at the OC Register, this all could’ve been prevented.

Hey, at least the flyball I highlighted doesn’t have the same issues. There is no guarantee it would’ve been out in Minute Maid, but we see the 367 sign behind Josh Hamilton when he catches it and we know that Minute Maid is 315 for a large portion of leftfield known as the Crawford Boxes.

ccarter3

click for huge picture

click for huge picture

Monday: 02.4.2013

Chris Carter Benefits from Trade to Houston

The Astros have a front office that understands how to rebuild. The best way to do it is to truly burn it to the ground and start over. In their latest such move, they traded Jed Lowrie and Fernando Rodriguez for Chris Carter, Brad Peacock, and Max Stassi. A 29-year old shortstop who is on the team until at least 2015 isn’t a bad asset for a rebuilding team like Houston, but a 26-year old slugger (who is probably a DH, but ostensibly can play first base or maybe leftfield which is where MLB Depth Charts has him as of now) and a 24-year old prospect arm who are under team control until 2019 are much better. This move is perfect for Carter.

Carter got his first real shot last year and popped 16 homers along with a .239/.350/.514 line in 260 plate appearances. He did strikeout 32 percent of the time, but also carried a strong 15 percent walk rate. He’s a classic three true outcome player and his new home is tailor-made for his game. His power plays anywhere so even in his cavernous home ballpark with Oakland he still had a .458 slugging percentage (the A’s as a team had a .392 slugging percentage at home) and five home runs despite the 89 home run park factor for right-handers. His move to Houston brings a major improvement to home venue as Minute Maid Park yields a 109 park factor to righties on home runs.

Plus, with Houston’s move to the AL West, Carter’s favorite venue from 2012 is still in play as he hit three of his 11 road homers in Texas in just six games. When you are dealing with a 260 plate appearance season, any parsing of that data is going to be subject to small sample size issues as the whole is already just a half season so keep that in mind, but it’s not like this power appeared out of nowhere for Carter. It’s always been his calling card so even with the scant samples, I’m confident in projecting that this move is a huge benefit for him. Consider also that his 182 home runs in 3647 plate appearances as a minor leaguer translate to about 30 per 600 plate appearances (29.9 to be exact). He hit 65 of those home runs in 1277 PAs in Triple-A which actually tops that overall rate checking in at 30.5 per 600 PA.

Thanks to Katron.org’s balls in play project, we can get a sense of how Carter might fare in Houston, or at least how he would’ve fared in Houston with last year’s batted ball distribution. The following is a mapping of Carter’s batted balls in Oakland on a Minute Maid Park overlay. You will see three leftfield batted ball outcomes labeled for what they were in Oakland, which would’ve likely gone for home runs in Houston. There is also a handful of warning track shots in left centerfield that might’ve gotten out in Houston depending on various circumstances. Meanwhile the five home runs were all no doubters on the Minute Maid overlay. Be mindful that this is all academic as he won’t have the exact same batted ball distribution in 2013, but it gives some sense of how his power production can improve with his new club.

CarterinMMP

By the way, Jed Lowrie was my Houston pick for the Countdown to Spring Training so don’t be surprised if this re-runs for the Houston CtST entry down the road. If I can find someone else I’m interested in, I’ll definitely go another way, but Carter is someone I really like so this fits pretty well, too. I didn’t really want to hold this analysis until Houston’s day, either. Meanwhile, Lowrie is unlikely to hold a spot in the Countdown as I had my eye on someone else for Oakland and don’t know if I want to switch it up.

Please be sure to check out the addendum to this piece.

Monday: 02.4.2013

2013 Starting Pitcher Guide Sample

As we turn the calendar over to February, baseball season is right around the corner. Many football fans close the book on that sport with the end of the Super Bowl and turn their attention back to baseball. Two weeks ago, I began taking pre-orders on the 2013 Starting Pitcher Guide and that will continue for another 10 days through Valentine’s Day. Perhaps you’re on the fence about the purchase and a trip down memory lane through the previous guides isn’t what you looking for to get you over the proverbial hump. Well how about a sample of what you will be getting in this year’s guide? Yeah, that does sound nice, doesn’t it?

I had Doug send over his report card on Oakland youngster Jarrod Parker and paired it with my profile on him to give you a taste of the 2013 guide in the PDF found below.

PDF-logo

(left-click to view in browser;
right-click to save file to desktop)

Notice how robust the coverage is for the 24-year old Parker. Nearly 500 words went into it. I mentioned this in the SP Guide Announcement, but I’ll reiterate here that the effort expended in the guide will be spent on those who can move the needle forward on your 2013 season. There will still be prospect coverage without question, but there were instances in last year’s guide of a Low-A prospect with no shot of contributing in 2012 getting a 200-plus word write up when 75-100 would’ve been sufficient and that surplus could’ve been better spent elsewhere.

This is especially important because not the majority of folks do no play in dynasty leagues or leagues with a minor league taxi roster of three to five guys. Don’t worry, dynasty leaguers, I’m not leaving you out in the cold. The top prospects and those are on the rise will still get their due, but I can tell who to chase down in a more efficient way than I did last year.

Finally, for those unfamiliar with 20-80 scale used in Doug’s Mechanics Report Card, don’t fret as it will be explained in an essay from him in the guide. In the meantime, understand that a 50 grade is average and not at all an indictment of talent.

Questions & comments can be directed to thespguide@gmail.com

Order now to save 25%!!!

btn_buynowCC_LG